kage
kage
opencode.ai
Design analysis
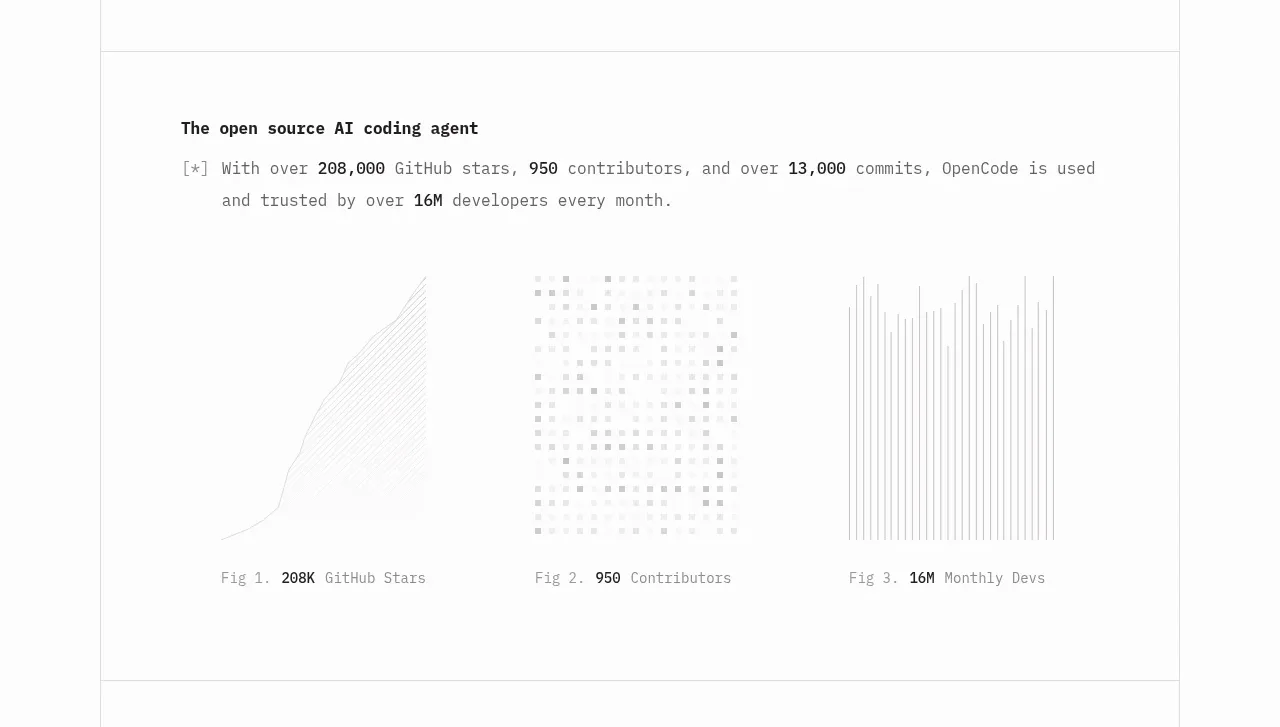
A concise trust statement is followed by three lightweight data visualizations and captions, turning adoption claims into an editorial proof block.
Prompt preview
## Reference images

Study these alongside the description below: hierarchy, rhythm, spacing, colour. Build for the product you are asked about, using this design language.

- Component: https://kage-design-assets.t3.tigrisfiles.io/components/opencode-2-0/565a21f1-5840-46fe-9e23-a71210513fd4-1791957896-3.webp
- Full page it was cut from: https://kage-design-assets.t3.tigrisfiles.io/screenshots/opencode-2-0/565a21f1-5840-46fe-9e23-a71210513fd4-1791957827568-full.webp
- Component on Kage: https://kage.design/component/opencode-2-0-stats

## Before you start
Ask what measurable outcomes matter for the user's product and what visual language matches its brand. Use those answers instead of copying the reference metrics.

Create a metrics section with a short trust-oriented heading and paragraph above a three-column strip of understated data visualizations. Each visual should be a simple monochrome chart—such as an area trend, dot matrix, and vertical bars—with a small caption underneath containing a figure number, metric, and value. Use a generous white/off-white canvas, thin #d9d9d9 strokes, very light gray fills, and no chart junk or axes unless needed for comprehension. Keep columns equal width, align captions to the chart bottoms, and use 11–13px monospace labels with bold values. Make charts responsive by stacking or using a horizontal scroll on narrow screens, and provide accessible text summaries.

Never: use the reference logo, product name, copy, illustrations, or imagery.