kage
kage
firecrawl.dev

Design analysis
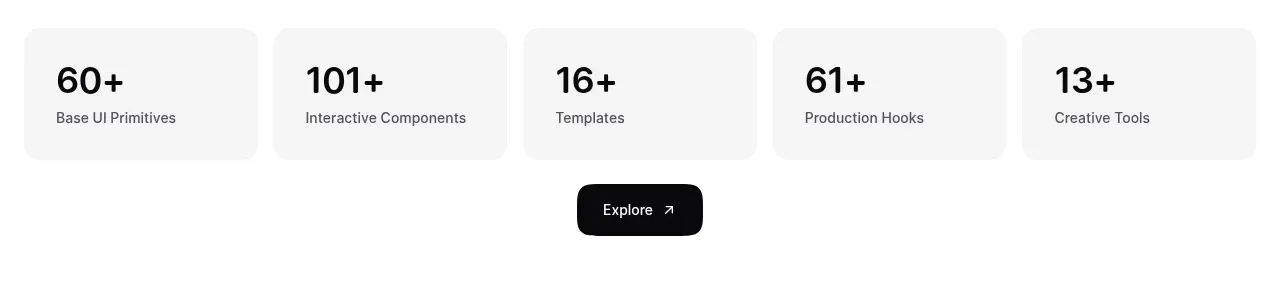
A thin bordered four-column metric row turns the abstract ecosystem into scannable proof points.
Prompt preview
## Reference images

Study these alongside the description below: hierarchy, rhythm, spacing, colour. Build for the product you are asked about, using this design language.

- Component: https://kage-design-assets.t3.tigrisfiles.io/components/alexandria-by-firecrawl/0b1c70de-f8b6-4b9f-90b5-f9bf706672fa-1790229692-4.webp
- Full page it was cut from: https://kage-design-assets.t3.tigrisfiles.io/screenshots/alexandria-by-firecrawl/0b1c70de-f8b6-4b9f-90b5-f9bf706672fa-1790229655966-full.webp
- Component on Kage: https://kage.design/component/alexandria-by-firecrawl-stats

## Before you start
Ask which measurable facts best establish trust for the user's product and which units or qualifiers matter to its audience.

Build a four-column statistics strip beneath the ecosystem visual. Center a tiny muted overline above the row, then use equal cells separated by hairline vertical borders. Each cell should contain a large accent-colored number, a compact dark label, and a muted one-line qualifier. Use an off-white or white background, #f15a24 for numbers, #202020 for labels, and #8a8a8a for qualifiers. Keep numbers around 28–34px with tight line-height, cell padding around 24px, and borders near #ededed. Stack the cells into a two-column or one-column layout on small screens while preserving the hierarchy.

Never: use the reference's numbers, product names, logos, exact copy, illustrations, or imagery.