 kage
kage
basedash.com

Design analysis
This section works by pairing a clear, centered promise with a believable dashboard preview that feels like a product interface rather than a decorative illustration. The asymmetric card grid, restrained palette, and overlaid prompt field communicate both data depth and effortless AI configuration.
Prompt preview
## Reference images

Study these alongside the description below: hierarchy, rhythm, spacing, colour. Build for the product you are asked about, using this design language.

- Component: https://kage-design-assets.t3.tigrisfiles.io/components/basedash-in-espanol-francais-portugues/b3381e01-f9b6-42c9-8798-975c026618b1-1789106702-3.webp
- Full page it was cut from: https://kage-design-assets.t3.tigrisfiles.io/screenshots/basedash-in-espanol-francais-portugues/b3381e01-f9b6-42c9-8798-975c026618b1-1789106655341-full.webp
- Component on Kage: https://kage.design/component/basedash-in-espanol-francais-portugues-feature-grid

## Before you start
Ask the user what their product does, who it is for, and what their brand guidelines are. Then apply the principles below to create an original feature-grid section for that product—not a copy of the reference.

## Goal
Build a responsive feature section that presents an AI-assisted analytics or workflow experience through a compact dashboard preview. The section should make a complex capability feel easy: users can describe an outcome in natural language, while the interface preview proves that the product can produce useful, structured information.

## Design language

### Layout and alignment
- Use a warm, near-white page background, approximately `#FAF8F5`.
- Center the section within a max-width of roughly `980–1120px`, with generous horizontal padding on smaller screens.
- Start with a centered heading and supporting sentence. Keep the heading to one or two lines and use a confident, plain-language statement about the product capability.
- Place the interface preview below the copy with a comfortable vertical gap of about `36–52px`.
- Build the preview as a dashboard-like grid with deliberate asymmetry:
  - a wide primary chart card spanning most of the first row;
  - a narrower secondary chart card beside it;
  - two compact metric cards in the next row;
  - a wider table, cohort, or status card completing the row.
- Use CSS Grid so the layout is structurally responsive rather than positioned with fixed offsets. On narrow screens, stack the cards while preserving the visual priority of the main card.
- Add a natural-language prompt/control over the lower portion of the main dashboard area. It should feel integrated into the interface, not like a separate hero button.
- Leave substantial whitespace after the preview before the next section begins; the whitespace is part of the premium, calm composition.

### Typography hierarchy
- Use a modern sans-serif with neutral shapes and good numeral rendering. Use the product’s brand font when available.
- The section heading should be large and light-to-medium weight, approximately `48–56px` desktop, `34–40px` mobile, with a tight line-height around `1.05–1.15`.
- Supporting copy should be approximately `18–20px`, line-height `1.4–1.5`, and a muted charcoal colour.
- Dashboard labels should be small, around `13–14px`, using medium grey text.
- Primary dashboard values should be visually strong but not excessively bold, around `32–38px`; secondary deltas and annotations should be smaller and use restrained semantic colours.
- Keep text alignment consistent within each card: labels and values should align to the same left inset, while chart axes and tables remain quiet and secondary.

### Colour
- Use a soft ivory page background around `#FAF8F5` or adapt it to the user’s brand.
- Use warm white card surfaces around `#FFFDF9`.
- Use near-black primary text around `#181716` and muted text around `#6F6B67`.
- Use very pale grey-beige dividers around `#E3E0DB`.
- Keep charts intentionally subdued: warm grey lines and bars around `#AAA7A1`, with one soft accent line such as dusty rose `#D8A39A` or a brand-appropriate equivalent.
- Use restrained status colours: muted green around `#67B58F` for positive/live states and muted rose around `#C98592` for negative changes. Avoid saturated dashboard colours.
- Ensure all real text remains accessible; decorative chart strokes may be low contrast but should not carry essential meaning alone.

### Borders, radius, and depth
- Give cards a thin `1px` border in a pale neutral colour, approximately `#E0DDD7`.
- Use medium rounded corners, around `12–14px`; the prompt field may use a slightly larger radius, around `12px`.
- Avoid heavy shadows. If depth is needed, use a very soft shadow such as `0 6px 20px rgba(30, 24, 18, 0.04)`.
- Keep card padding consistent, generally `16–20px`, with more breathing room in the primary chart card.
- Use subtle horizontal and vertical rules in tables, never dark grid lines.

### Dashboard details
- Make the preview feel operational but not cluttered: include a chart, KPI values, a compact bar graph, and a table or cohort-style structure.
- Use believable placeholder data generated for the user’s product domain, but keep it secondary to the composition.
- Include small date ranges, deltas, labels, and a live/status indicator only where they help establish hierarchy.
- Render charts with lightweight SVG or CSS shapes. Do not rely on an external charting library unless the surrounding project already uses one.
- The overlaid prompt/control should be a rounded, pale tinted input-like element with readable text, a caret or affordance, and enough contrast to distinguish it from the card beneath. On mobile, place it inside the card flow rather than allowing it to overflow the viewport.
- If interactive behaviour is implemented, support focus, keyboard access, and a subtle hover/focus transition. The prompt may animate its caret or accept text, but avoid distracting motion.

### Responsive behaviour
- At desktop widths, preserve the wide-primary/narrow-secondary rhythm and the compact-card plus wide-table row.
- At tablet widths, let the main card and secondary chart share a row only when both retain comfortable readability.
- At mobile widths, stack cards in a meaningful order: heading, primary insight, prompt, secondary insight, compact metrics, then detail table.
- Reduce card padding and chart height slightly on mobile, but do not make the dashboard feel cramped.
- Prevent horizontal scrolling and ensure the prompt field, table content, and values wrap or simplify gracefully.

## Never
- Never copy any logos, product names, brand marks, or recognizable UI labels from the reference.
- Never reuse the reference’s exact marketing copy, dashboard data, chart shapes, or numerical values.
- Never include illustrations, photos, or imagery from the reference; communicate the idea through original UI-like data visualizations only.
- Never reproduce the exact card dimensions, grid coordinates, typography, or visual treatment as a pixel-for-pixel clone.
- Never make the interface look like a static screenshot if the user’s product would benefit from real semantic HTML and accessible interaction.
- Never let decorative charts replace readable labels or accessible content.
More components
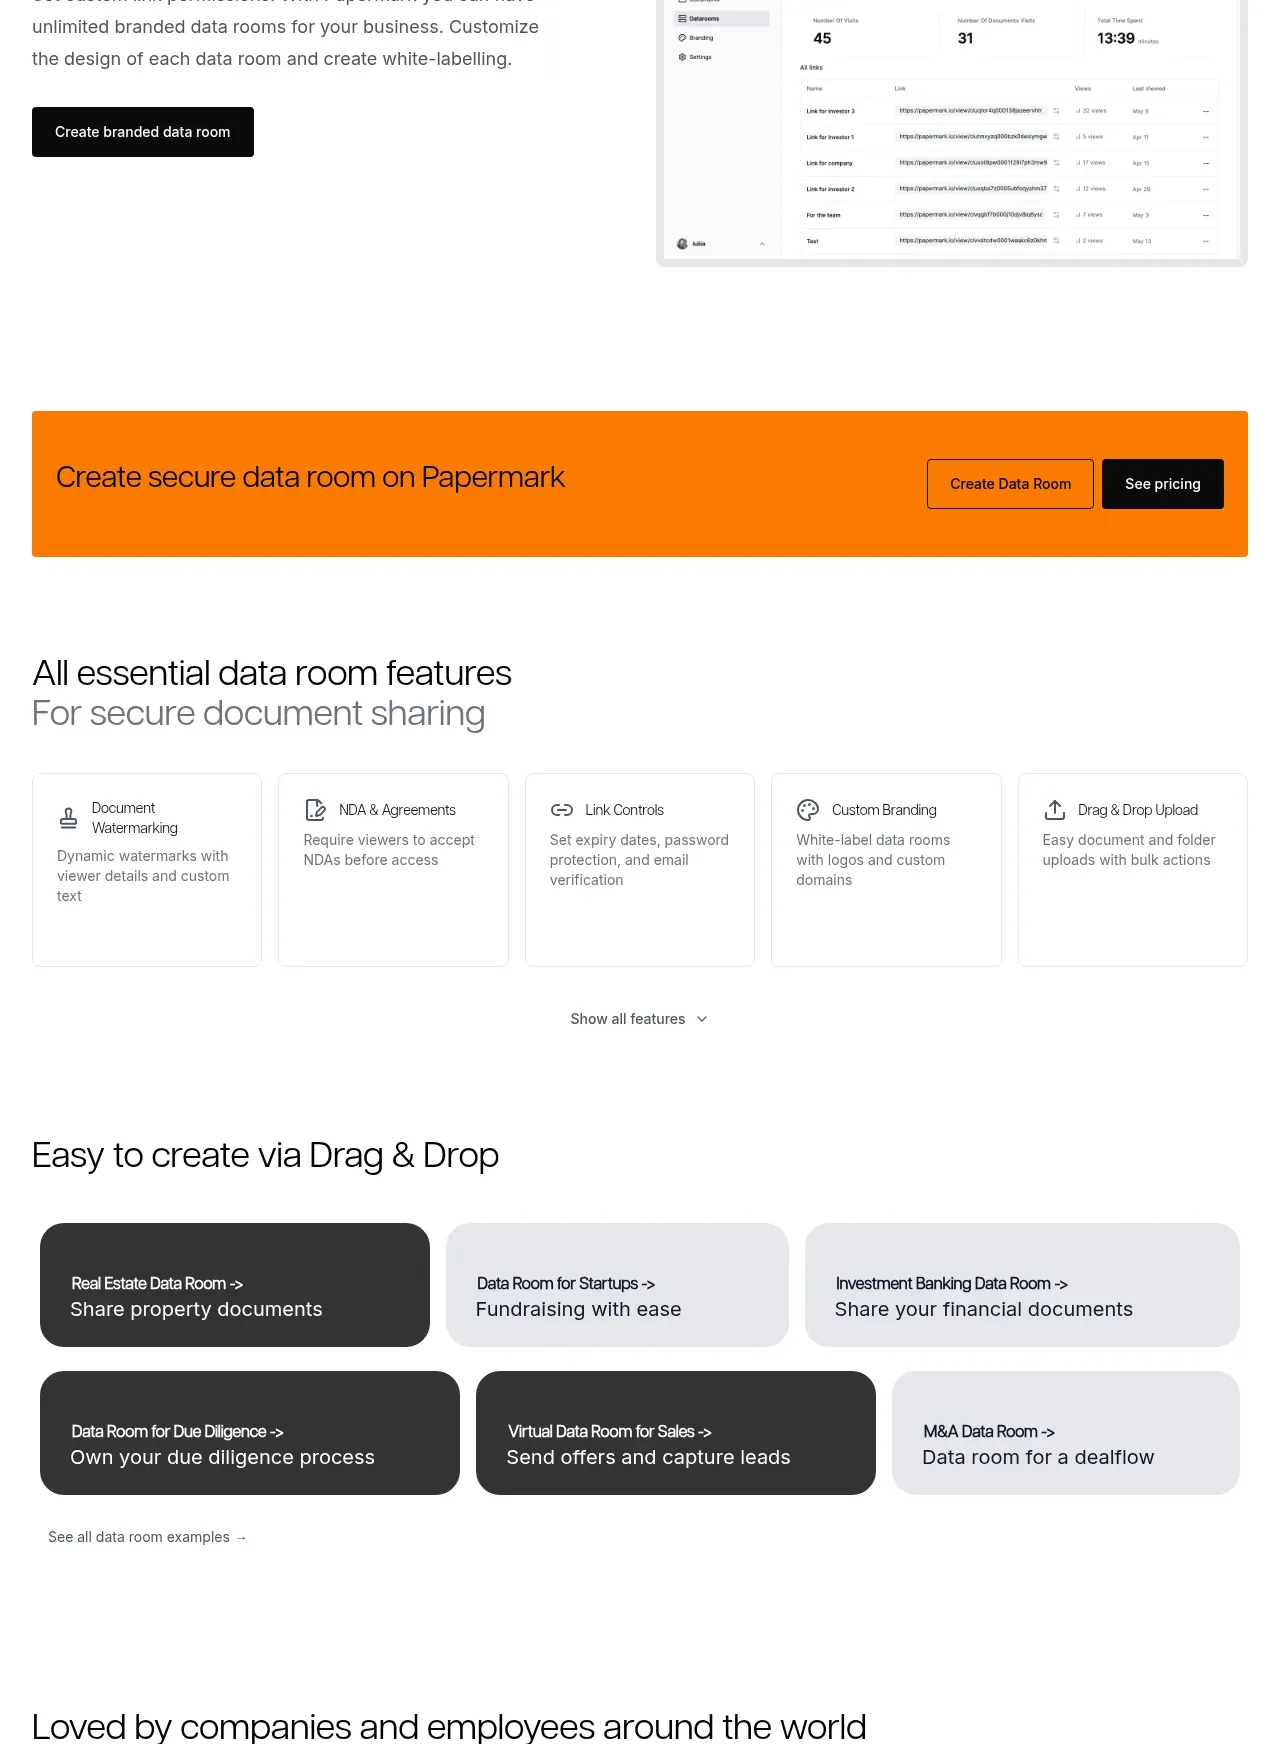
 Workflow demonstrations
Papermark Data Rooms · Feature grid
Workflow demonstrations
Papermark Data Rooms · Feature grid
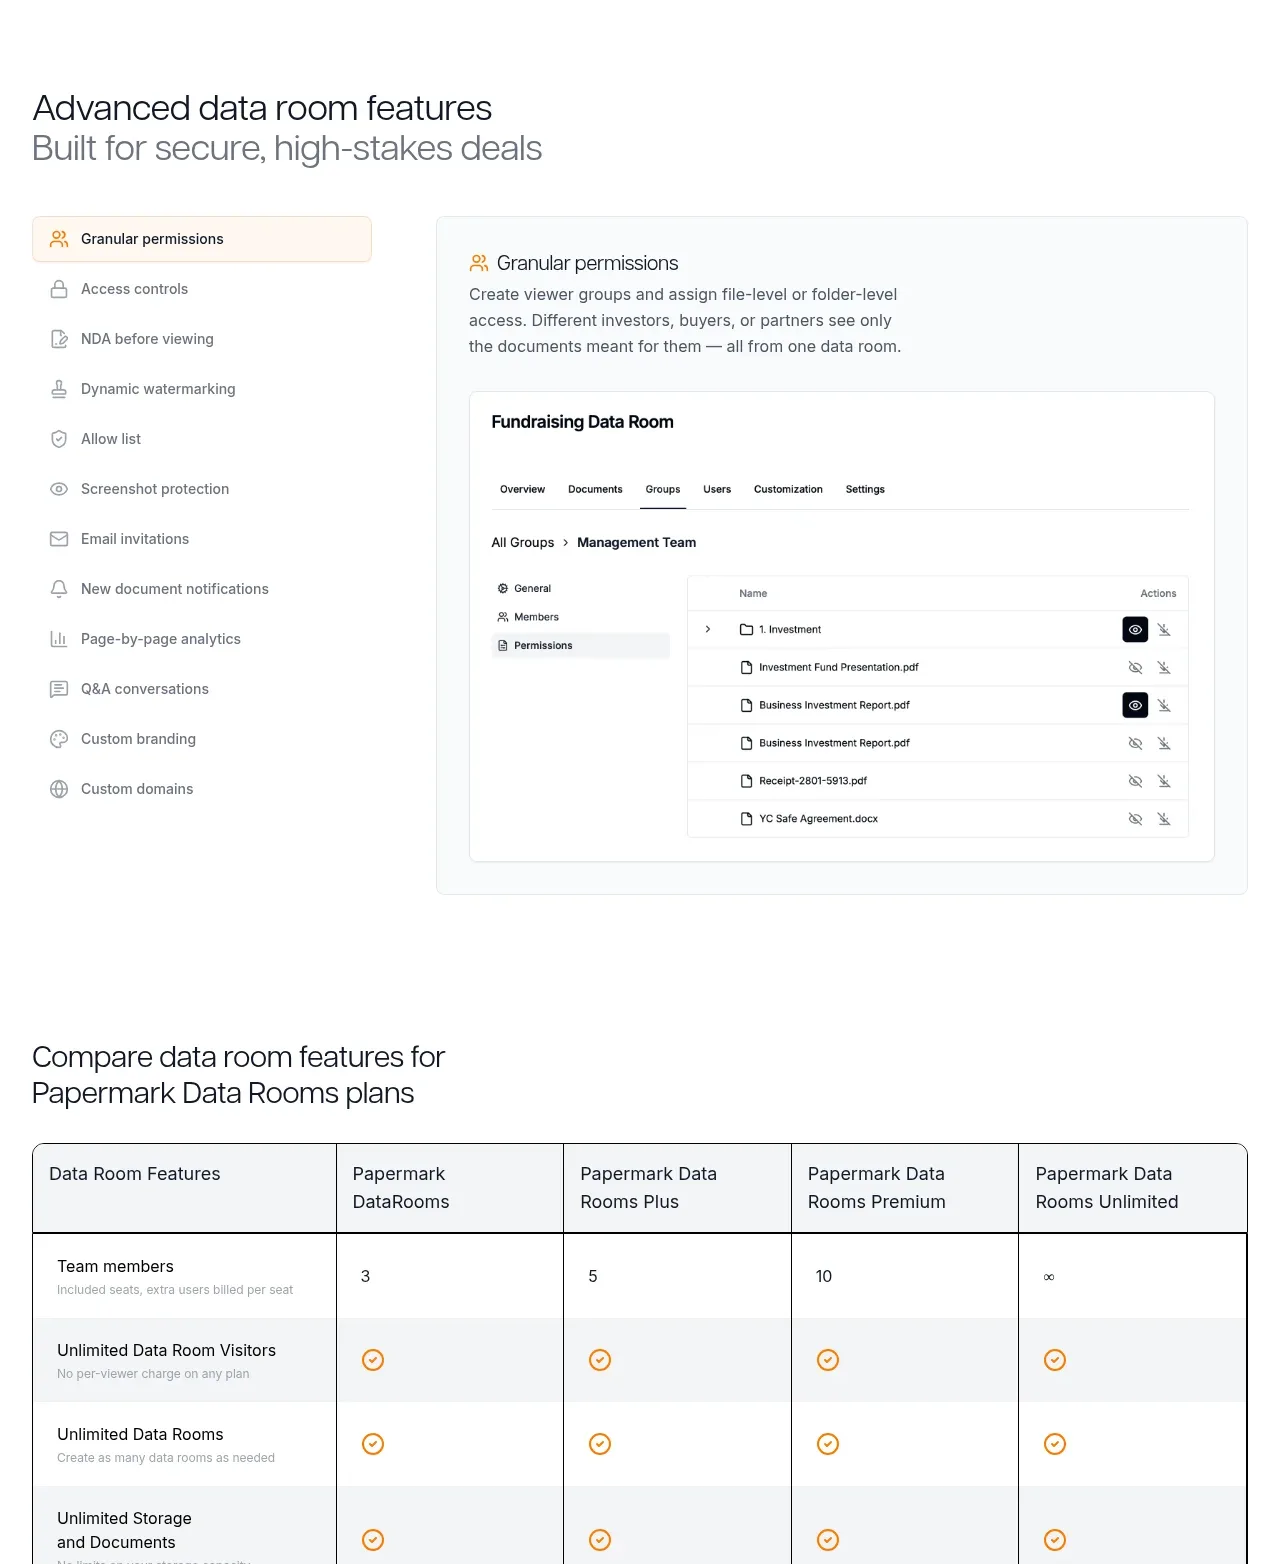 Advanced data-room features
Papermark Data Rooms · Feature grid
Advanced data-room features
Papermark Data Rooms · Feature grid
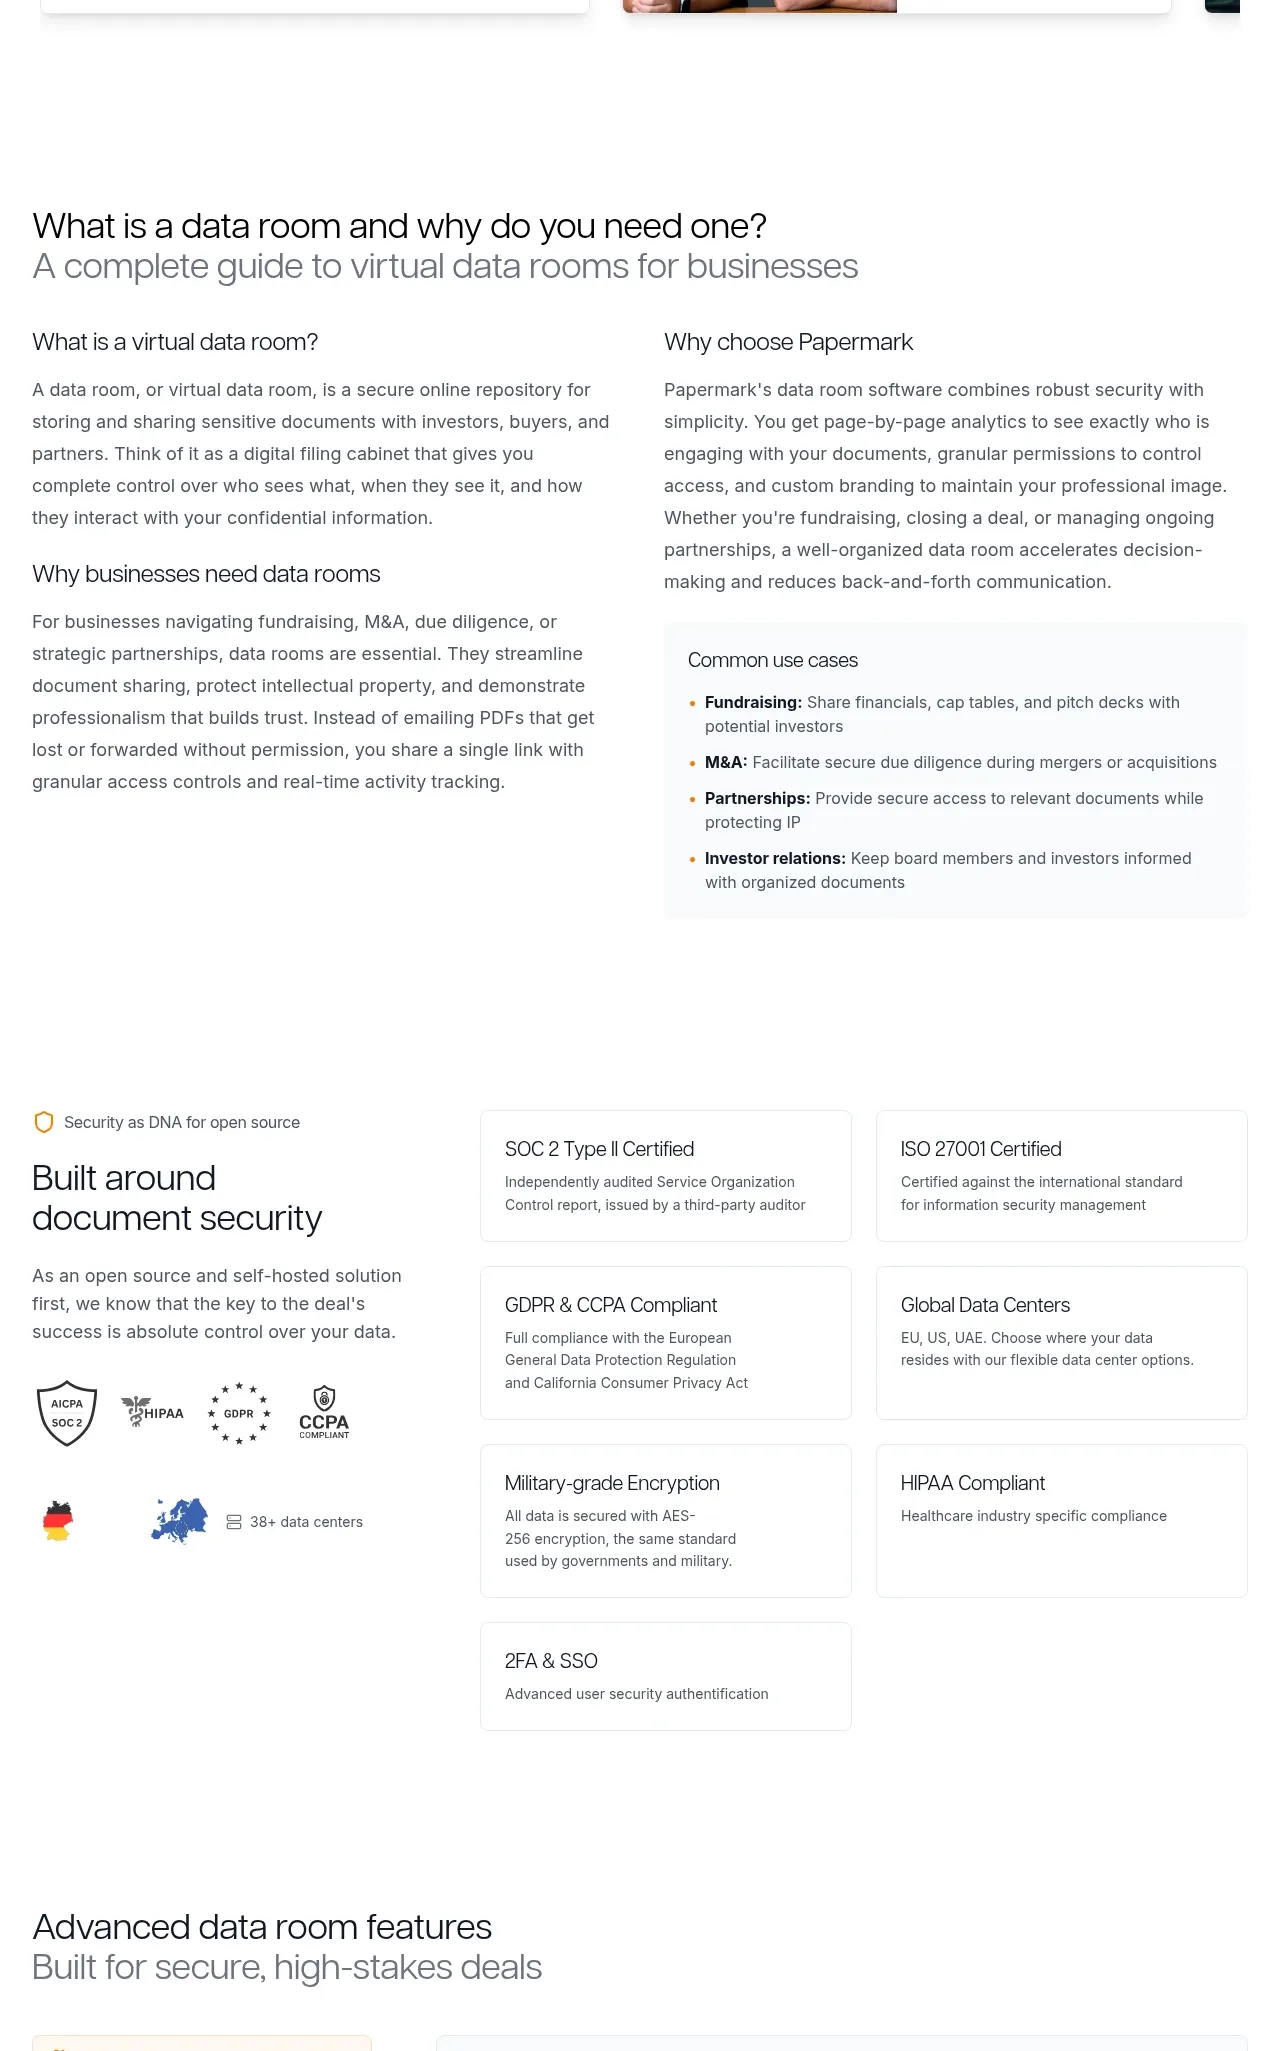 Data-room education and security overview
Papermark Data Rooms · Feature grid
Data-room education and security overview
Papermark Data Rooms · Feature grid
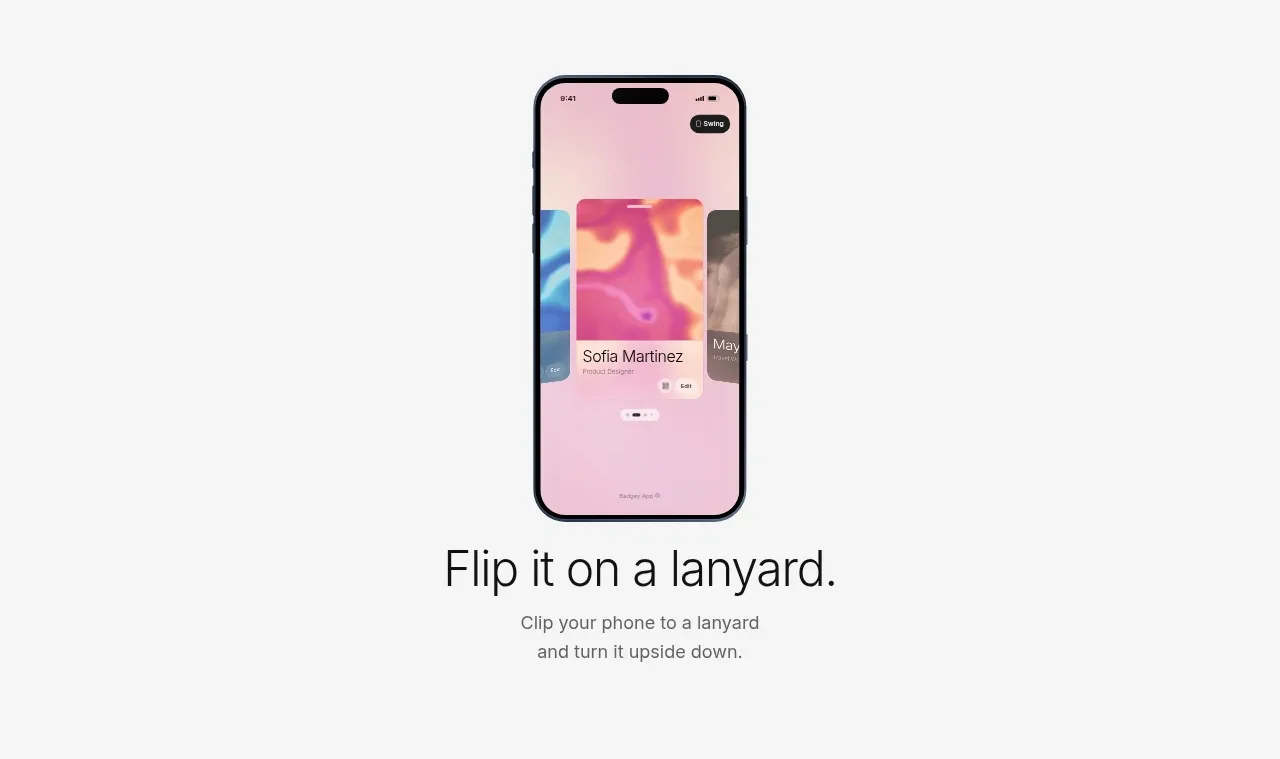
 Lanyard use-case feature
Badgey · Feature grid
Lanyard use-case feature
Badgey · Feature grid
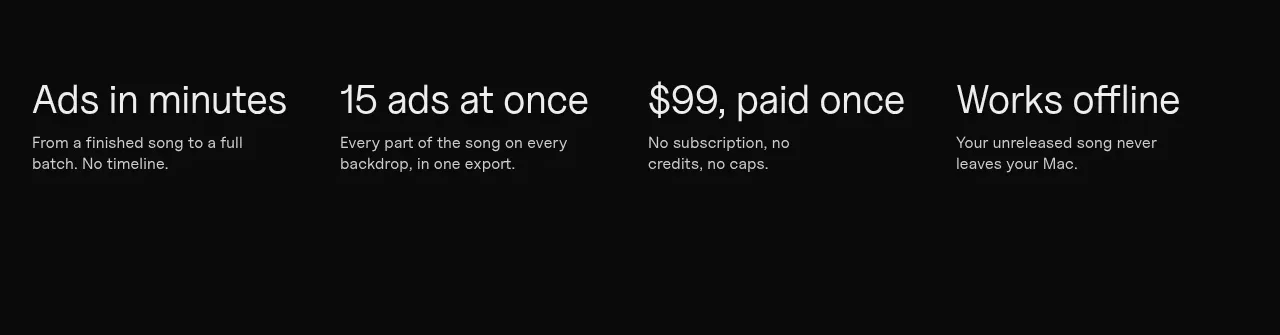
 Four value propositions
Clips by Plastic · Feature grid
Four value propositions
Clips by Plastic · Feature grid
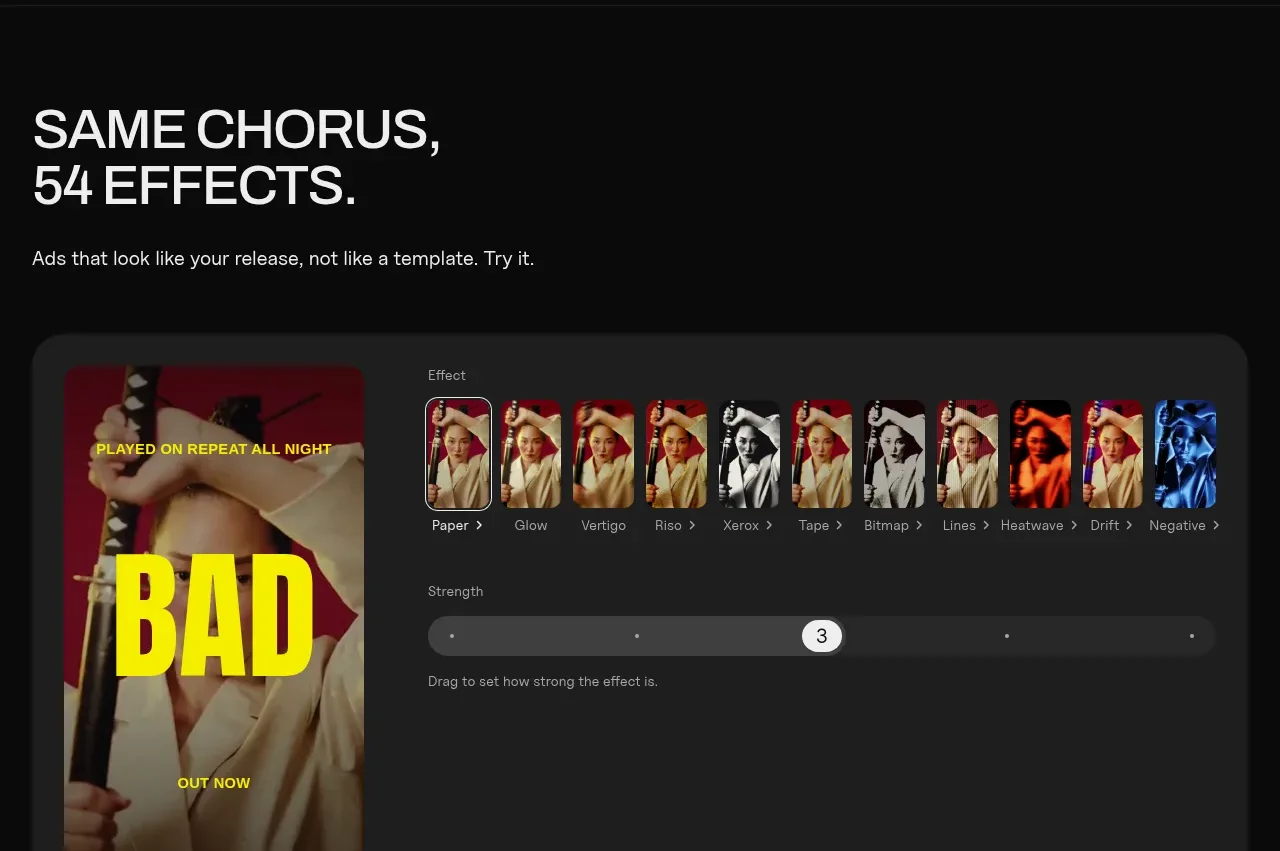 Effects and customization panel
Clips by Plastic · Feature grid
Effects and customization panel
Clips by Plastic · Feature grid