 kage
kage
deno.com

Design analysis
This section works by pairing a strong, centered editorial introduction with a disciplined matrix of compact benchmark cards. Consistent bar charts, restrained colour coding, clear labels, and ample whitespace make dense comparative data easy to scan without feeling like a dashboard.
Prompt preview
## Reference images

Study these alongside the description below: hierarchy, rhythm, spacing, colour. Build for the product you are asked about, using this design language.

- Component: https://kage-design-assets.t3.tigrisfiles.io/components/deno-com/32c2f827-c733-4746-82ec-fc83a363518f-1789073867-7.webp
- Full page it was cut from: https://kage-design-assets.t3.tigrisfiles.io/screenshots/deno-com/32c2f827-c733-4746-82ec-fc83a363518f-1789073825-full.webp
- Component on Kage: https://kage.design/component/deno-feature-grid-4

## Before you start
Ask the user what their product is, who it is for, and what visual brand or design system it uses. Then apply the principles below to create an original version for that product—not a copy of the reference.

## Goal
Build a polished feature or performance comparison section that communicates several related proof points at a glance. It should feel like an editorial marketing section rather than a dense analytics dashboard: a centered introduction, a clean grid of comparison cards, and a small methodology note beneath it.

## Design language

### Layout and alignment
- Use a soft, near-white tinted section background, approximately `#F6F9FD`, with generous vertical padding.
- Constrain the content to a centered max-width of roughly `1120–1200px`.
- Place a centered heading and supporting paragraph above the grid. Keep the text measure around `620–700px` so the introduction remains readable.
- Use a three-column card grid on desktop with consistent gaps of `16–20px`; use two columns at medium widths and one column on small screens.
- Build 6–9 cards in a balanced matrix. Every card should have equal visual weight and a consistent internal structure.
- Align card contents to the top and use the same left and right inset, approximately `32px` desktop and `24px` mobile.
- Add a small centered footnote below the cards, with enough separation to read as methodology or source context rather than another card.

### Typography hierarchy
- Use a modern sans-serif appropriate to the user's brand. If no brand font is available, use a clean system sans stack.
- Make the section heading bold and prominent, around `40–48px` desktop with tight line-height around `1.05`; reduce to `32–38px` on mobile.
- Use a short supporting paragraph at `18–20px`, line-height around `1.5`, in a muted charcoal colour.
- Card titles should be semibold, approximately `16px`, with a compact line-height.
- Card subtitles such as “higher is better” or “lower is better” should be `12–13px` and muted.
- Comparison labels and values should be `13–14px`; make the highlighted product or best result semibold, while secondary entries remain regular weight.
- Use tabular numerals for measurements where possible so values align cleanly.
- Set the methodology note in an italic or subdued `12–13px` style with comfortable line-height.

### Cards and data bars
- Use white cards, approximately `#FFFFFF`, with a subtle `1px` border around `#DDE3E8` and a very soft shadow such as `0 5px 14px rgba(20, 30, 40, 0.08)`.
- Use a restrained radius of `6–8px`; avoid overly rounded “app dashboard” styling.
- Give each card a minimum height that allows three comparison rows to breathe, roughly `245–260px` depending on content.
- Structure every card as: title, directional subtitle, then a vertical list of comparison rows.
- Each row contains a label/value line followed by a horizontal track. Keep row spacing consistent, around `14–18px`.
- Tracks should be pill-shaped with a light neutral fill around `#E4E8E8`, approximately `8–10px` high.
- Use one vivid accent for the primary or emphasized result, such as a green around `#00D978` or an equivalent colour from the user's brand.
- Use near-black `#252525` for a strong secondary competitor and medium gray `#8A8D8D` for a tertiary comparator. Do not rely on colour alone: preserve labels and numerical values for accessibility.
- Scale bar lengths proportionally to the values within each card. For “lower is better” metrics, make the visual ranking clear through ordering, emphasis, or an accessible annotation rather than misleadingly reversing raw values without explanation.
- Keep values right-aligned and labels left-aligned on the same line. Highlight the featured item using weight and accent colour, not oversized type.

### Colour and surface treatment
- Prefer a mostly monochrome palette with one purposeful accent. The visual goal is clarity and trust, not decoration.
- Suggested neutrals: background `#F6F9FD`, card `#FFFFFF`, primary text `#111111`, secondary text `#5F6368`, border `#DDE3E8`, track `#E4E8E8`.
- Ensure text and bar colours meet accessible contrast requirements. Provide text labels and values even when bars communicate the same comparison.

### Responsive behaviour
- On narrow screens, collapse to one column and preserve the card's complete comparison structure; never squeeze the bars until labels become unreadable.
- Allow long metric names to wrap naturally while keeping values aligned.
- Reduce section padding and card insets modestly on mobile, but retain generous whitespace.

### Interaction and motion
- This can be a static component, but if the product needs interaction, support a subtle hover state: slightly stronger border, modest shadow increase, or a `1–2px` lift.
- If values animate on load, animate bars from zero to their final widths over `500–800ms` with an ease-out curve, respecting `prefers-reduced-motion`.
- Do not add filters, tabs, tooltips, or controls unless the user's content genuinely needs them; the reference pattern succeeds through immediate scanability.

## Content guidance
- Replace benchmark terminology with proof points relevant to the user's product: speed, reliability, capacity, workflow outcomes, coverage, or other measurable benefits.
- Use realistic sample values and clearly label the unit, direction, and comparison basis.
- Include a concise source or methodology note if the claims depend on test conditions.

## Never
- Never copy the reference's logos, product names, brand wording, benchmark names, numerical values, or exact marketing copy.
- Never reuse its distinctive illustrations, imagery, icons, or decorative artwork.
- Never reproduce the exact card text, dataset, layout proportions, or colour treatment as a branded imitation.
- Never make unsupported performance claims or imply that illustrative data is factual.
- Never hide the meaning of a metric behind colour or bar length alone.
- Never turn the section into a cluttered dashboard with unnecessary controls or ornamental effects.
More components
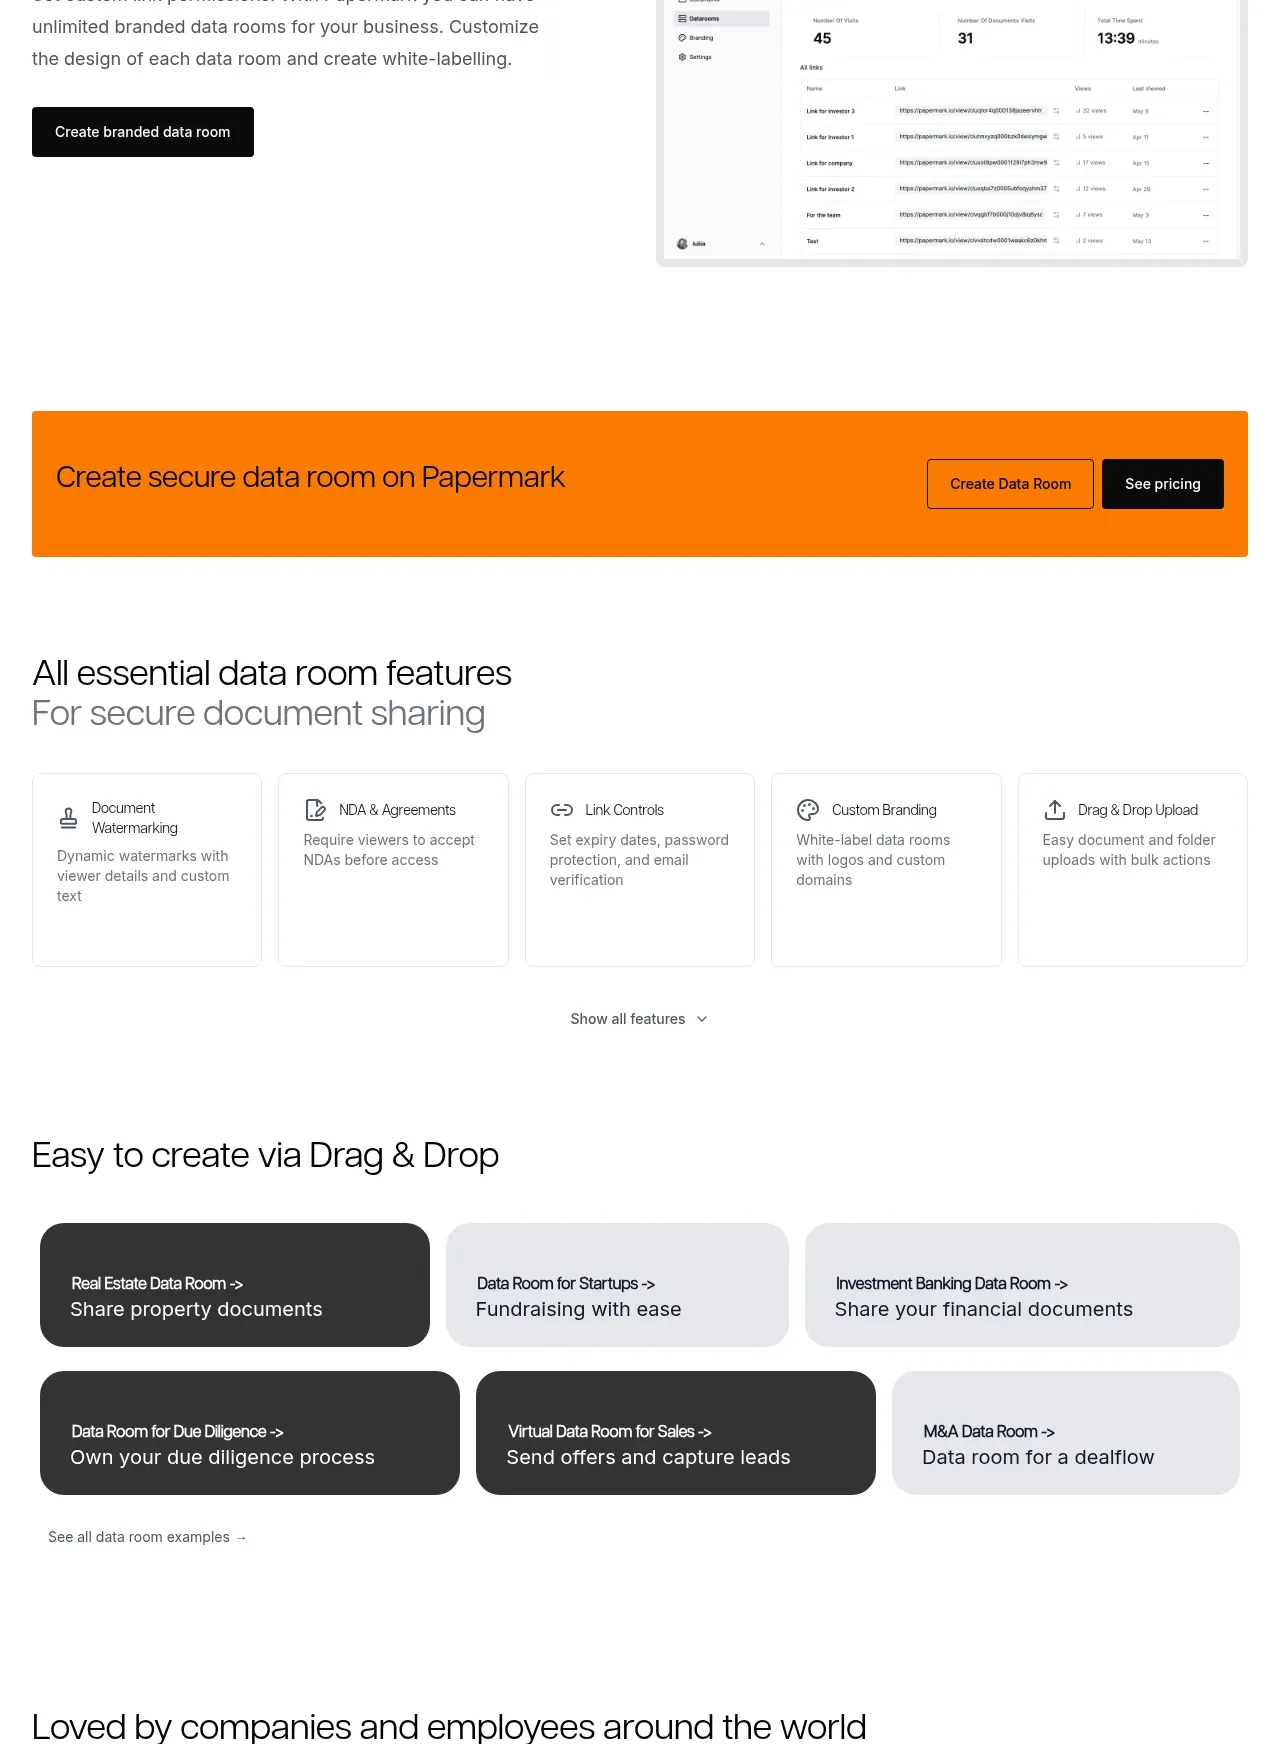
 Workflow demonstrations
Papermark Data Rooms · Feature grid
Workflow demonstrations
Papermark Data Rooms · Feature grid
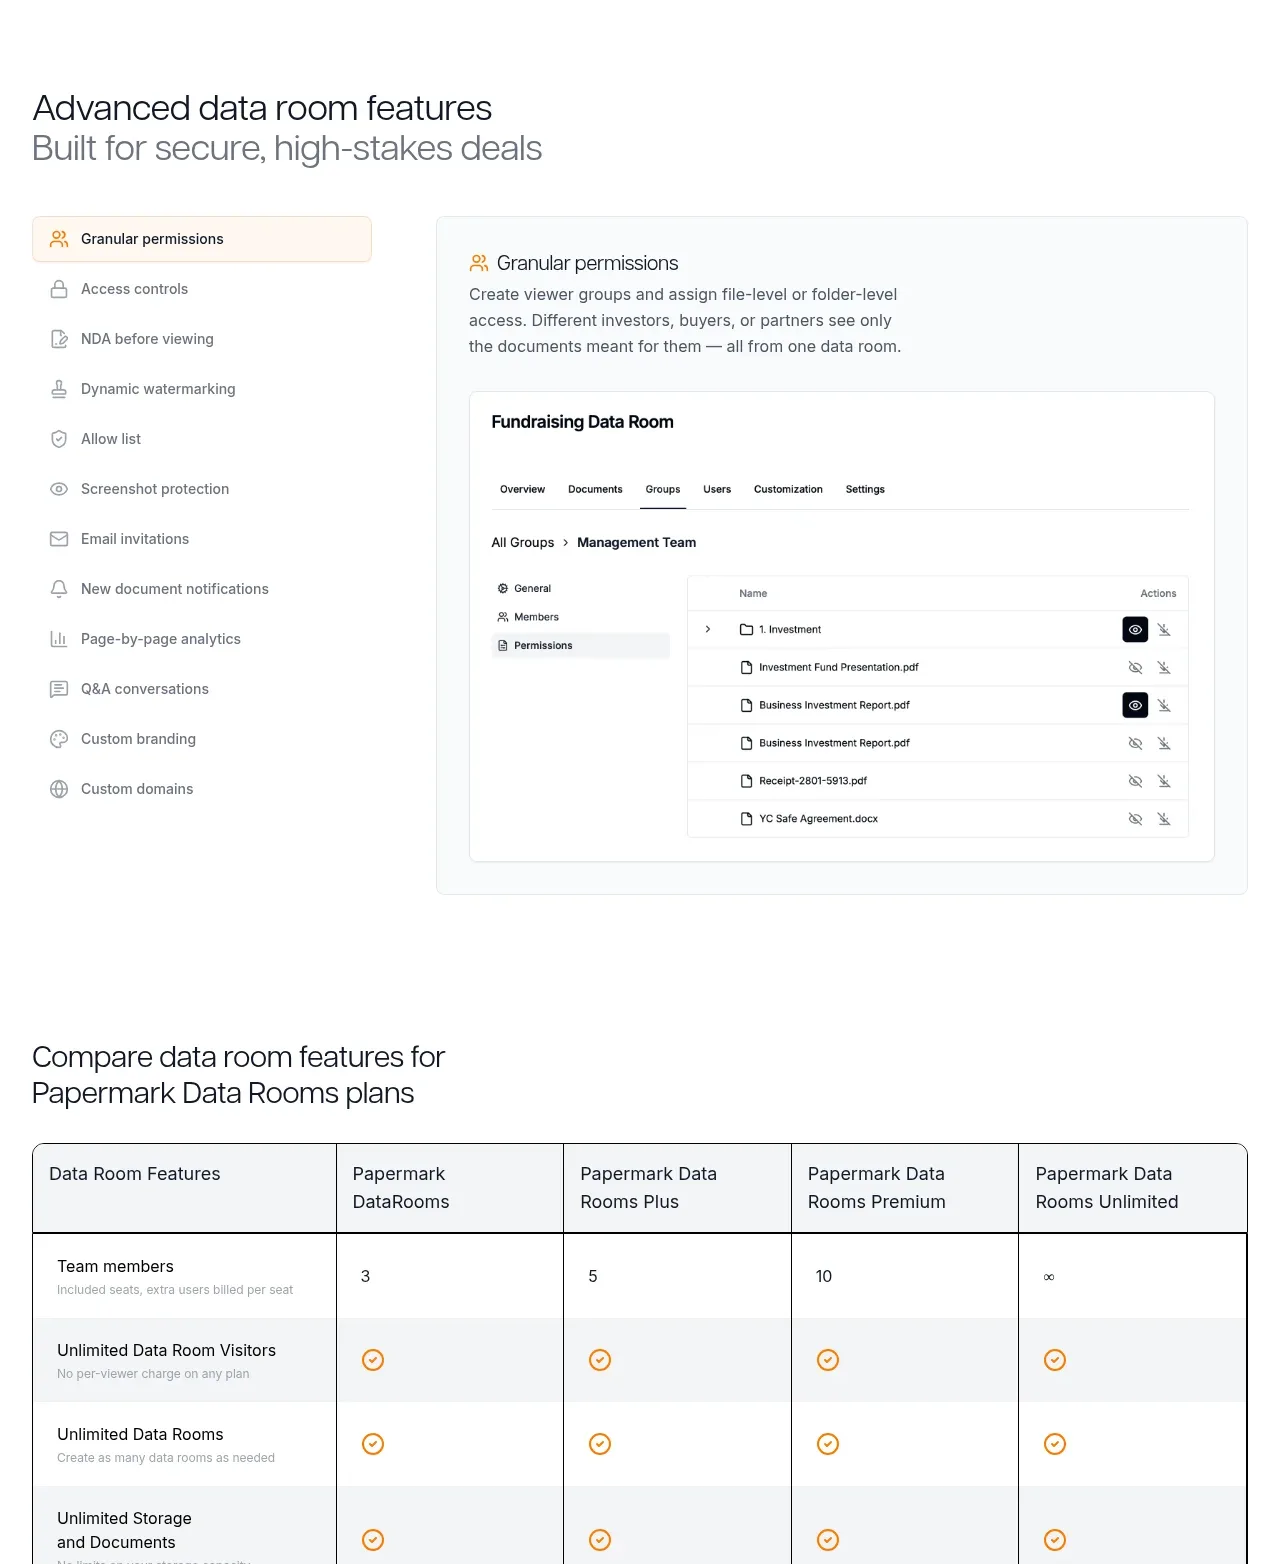 Advanced data-room features
Papermark Data Rooms · Feature grid
Advanced data-room features
Papermark Data Rooms · Feature grid
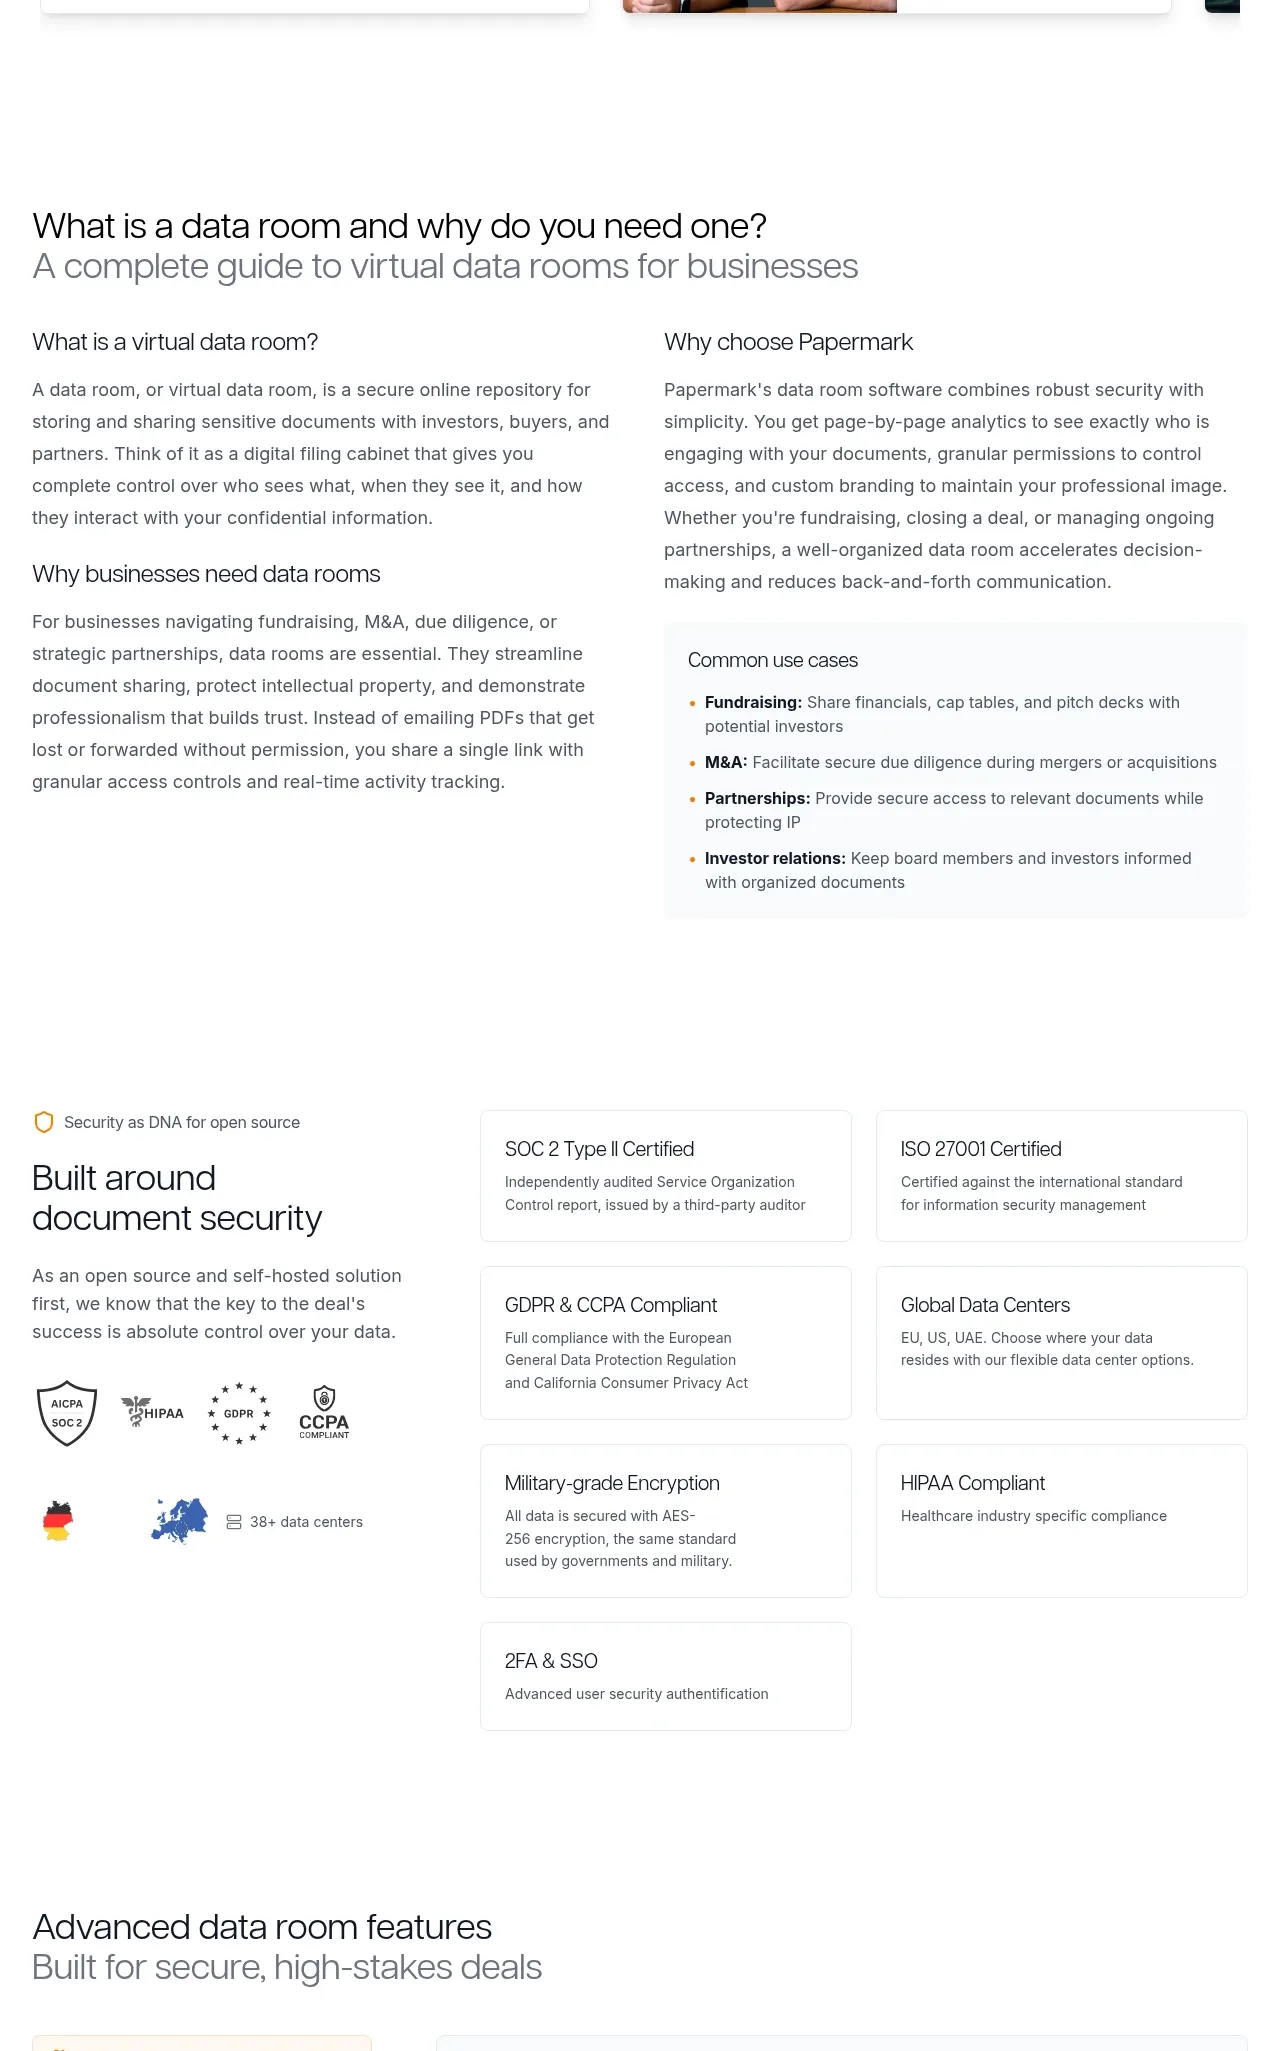 Data-room education and security overview
Papermark Data Rooms · Feature grid
Data-room education and security overview
Papermark Data Rooms · Feature grid
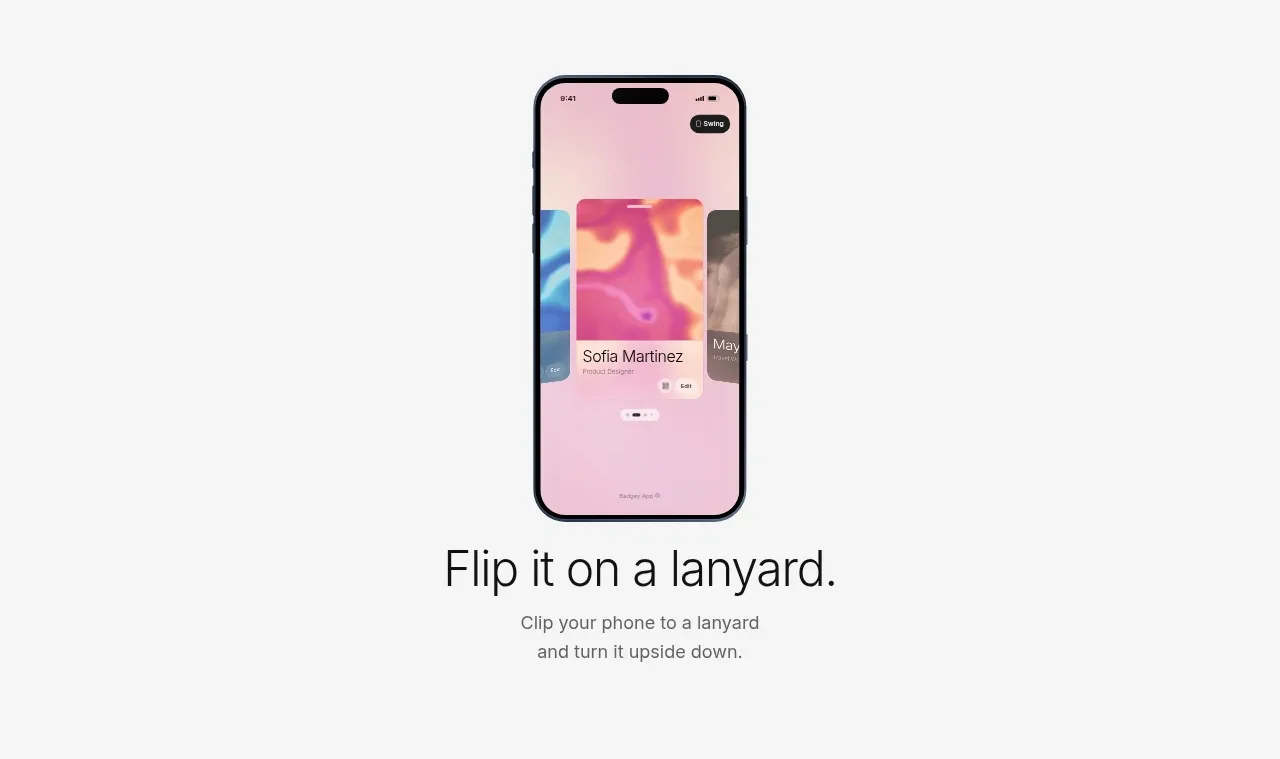
 Lanyard use-case feature
Badgey · Feature grid
Lanyard use-case feature
Badgey · Feature grid
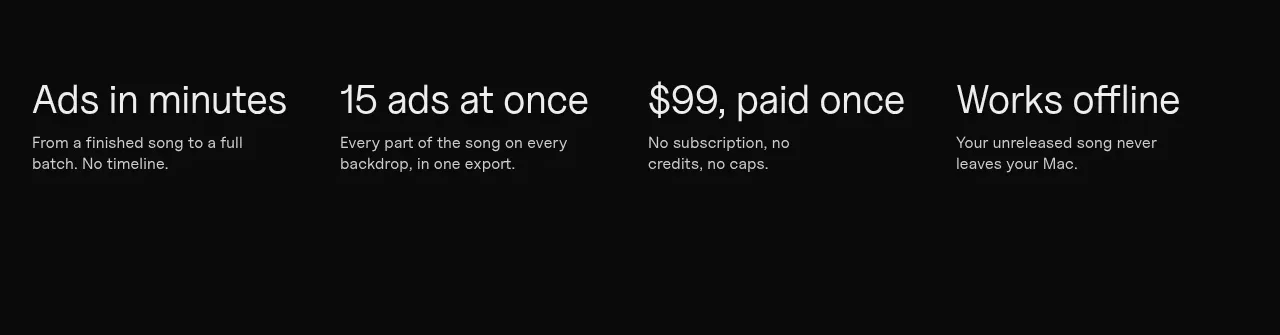
 Four value propositions
Clips by Plastic · Feature grid
Four value propositions
Clips by Plastic · Feature grid
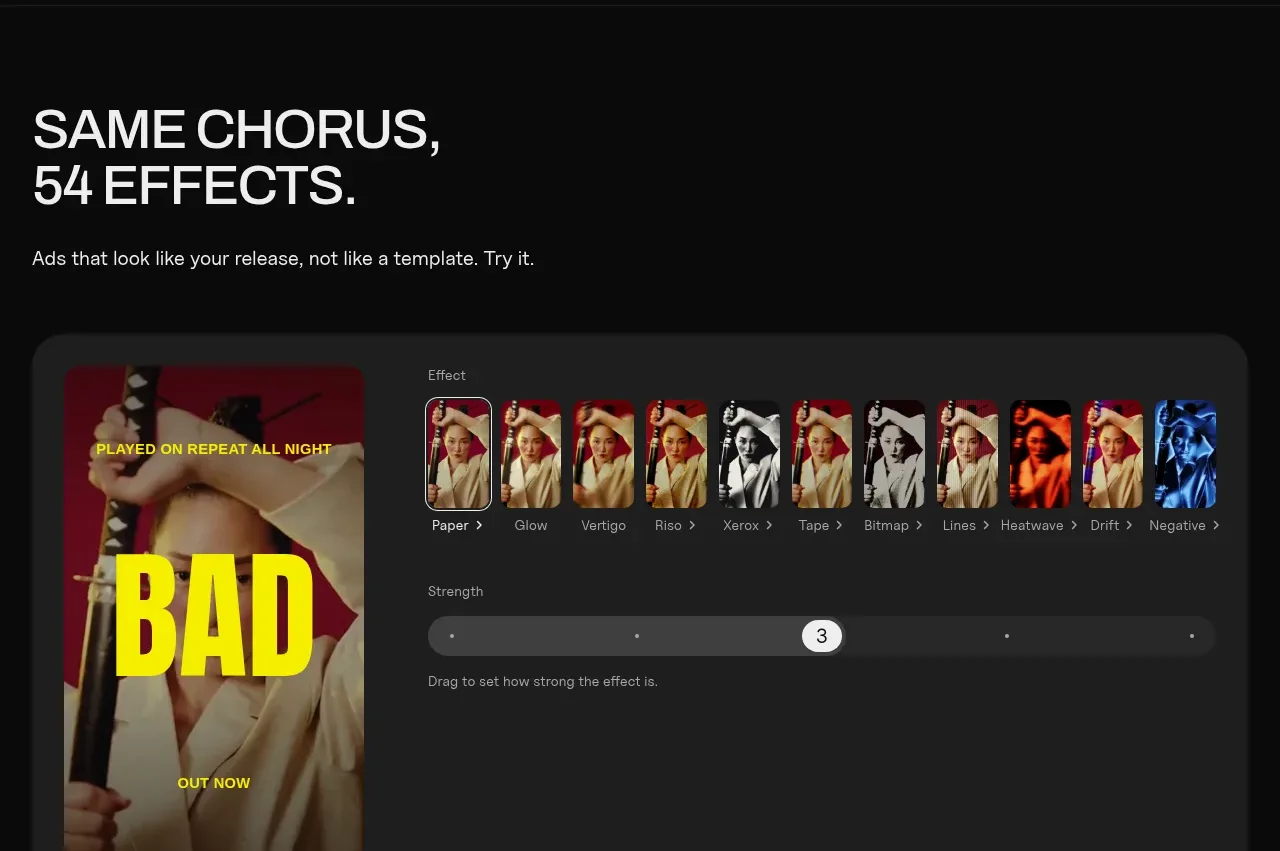 Effects and customization panel
Clips by Plastic · Feature grid
Effects and customization panel
Clips by Plastic · Feature grid