 kage
kage
drizzle.team

Design analysis
A restrained three-column directory of open-source projects, where each card combines a clear project label, one-line description, lightweight repository metrics, and a compact trend sparkline. The consistent card anatomy and generous whitespace make a large set of related tools easy to scan without feeling like a dense dashboard.
Prompt preview
## Reference images

Study these alongside the description below: hierarchy, rhythm, spacing, colour. Build for the product you are asked about, using this design language.

- Component: https://kage-design-assets.t3.tigrisfiles.io/components/drizzle-team/742c665e-9ce1-4c98-831f-72085091350d-1789073809-2.webp
- Full page it was cut from: https://kage-design-assets.t3.tigrisfiles.io/screenshots/drizzle-team/742c665e-9ce1-4c98-831f-72085091350d-1789073797-full.webp
- Component on Kage: https://kage.design/component/drizzle-team-feature-grid

## Before you start
Ask what the user's product does, who it is for, and what visual brand it should use. Then apply the principles below to create an original feature grid for that product—not a copy of the reference.

## Build a feature-grid section
Create a responsive directory of related features, tools, integrations, resources, or product capabilities. The section should feel editorial and technical: quiet, highly scannable, and information-dense without becoming a dashboard.

### Layout and alignment
- Place the component inside a centered content container with a generous maximum width, approximately 1160–1200px on desktop.
- Add a small uppercase section label above the grid, aligned with the grid’s left edge. Use it as a category marker rather than a large headline.
- Use a three-column grid on desktop, two columns at medium widths, and one column on narrow screens.
- Keep every card the same height within a row. Use consistent gaps of approximately 20px horizontally and vertically.
- Each card should have a clear top content zone and a lower metrics/trend zone. Align the lower zone to the bottom so cards remain visually consistent even when descriptions differ in length.
- Give the card inner padding of approximately 15–16px. The title and supporting text should share the same left edge; place the trend visualization toward the lower-right.

### Card anatomy
- Use a concise linked title followed by a subtle arrow or directional affordance. The title should be prominent but not oversized.
- Place a short, muted description directly beneath it. Limit it to one or two lines and truncate or constrain overflow when necessary.
- At the bottom, show one or two compact metrics with simple neutral icons, such as stars, downloads, usage, or activity. Keep these metrics secondary to the title.
- Pair the metrics with a small monochrome sparkline or area chart. The chart is a contextual visual cue, not a primary data-analysis interface: no axes, legend, labels, or excessive decoration.
- Use varied but plausible chart contours if the cards represent different entities. Preserve the same chart dimensions, stroke weight, and visual treatment across cards.

### Typography
- Use a neutral sans-serif system font or the product’s existing UI font.
- Section label: approximately 11–12px, uppercase, medium or semibold weight, with tight tracking and muted dark gray.
- Card title: approximately 18px, regular or medium weight, with a line-height around 1.25.
- Description: approximately 14px, regular weight, line-height around 1.4, in a softer gray.
- Metrics: approximately 11–12px, medium weight, with compact numerals and restrained contrast.
- Avoid oversized display typography; the component’s hierarchy should come from spacing and placement.

### Colour and visual treatment
- Use a warm or neutral near-white page background, approximately #FFFFFF to #FAFAF9.
- Use near-black charcoal text, approximately #242424–#303030.
- Use muted secondary text around #555555–#707070.
- Use subtle borders around cards, approximately #BFC1C1 or another low-contrast neutral. Keep borders 1px and avoid heavy shadows.
- Render the sparkline in charcoal, approximately #303536, with a pale gray filled area around #E7E9E9. Icons should use the same muted charcoal family.
- Keep the palette mostly monochrome unless the user’s brand calls for a restrained accent colour.

### Borders, sizing, and radius
- Use a small or zero radius—approximately 0–3px—to preserve a crisp, technical character.
- Keep the cards visually flat: no gradients, glass effects, or prominent shadows.
- Ensure the clickable title/card has a comfortable hit area and visible keyboard focus treatment.

### Interaction and responsive behaviour
- Make each card or its title link to the relevant destination.
- On hover, use a subtle border-colour shift, text darkening, or slight background tint; do not use large movement or dramatic animation.
- Add an accessible focus-visible outline with sufficient contrast.
- On mobile, stack cards vertically, retain the metrics and chart relationship, and allow long titles/descriptions to wrap naturally.
- Provide semantic structure: a section with a heading or label, a list/grid of items, meaningful link text, and accessible labels for metric icons and charts. If charts are decorative, mark them as such and expose the important metric values as text.

## Never
- Never copy the reference’s logos, product names, project names, descriptions, metrics, chart shapes, or exact copy.
- Never use the reference brand identity, trademarked assets, or distinctive content.
- Never add unrelated illustrations, stock imagery, or decorative artwork.
- Never make the grid look like a full analytics dashboard with axes, legends, filters, or excessive controls.
- Never rely on colour alone to communicate meaning, and never sacrifice readability for visual density.
More components
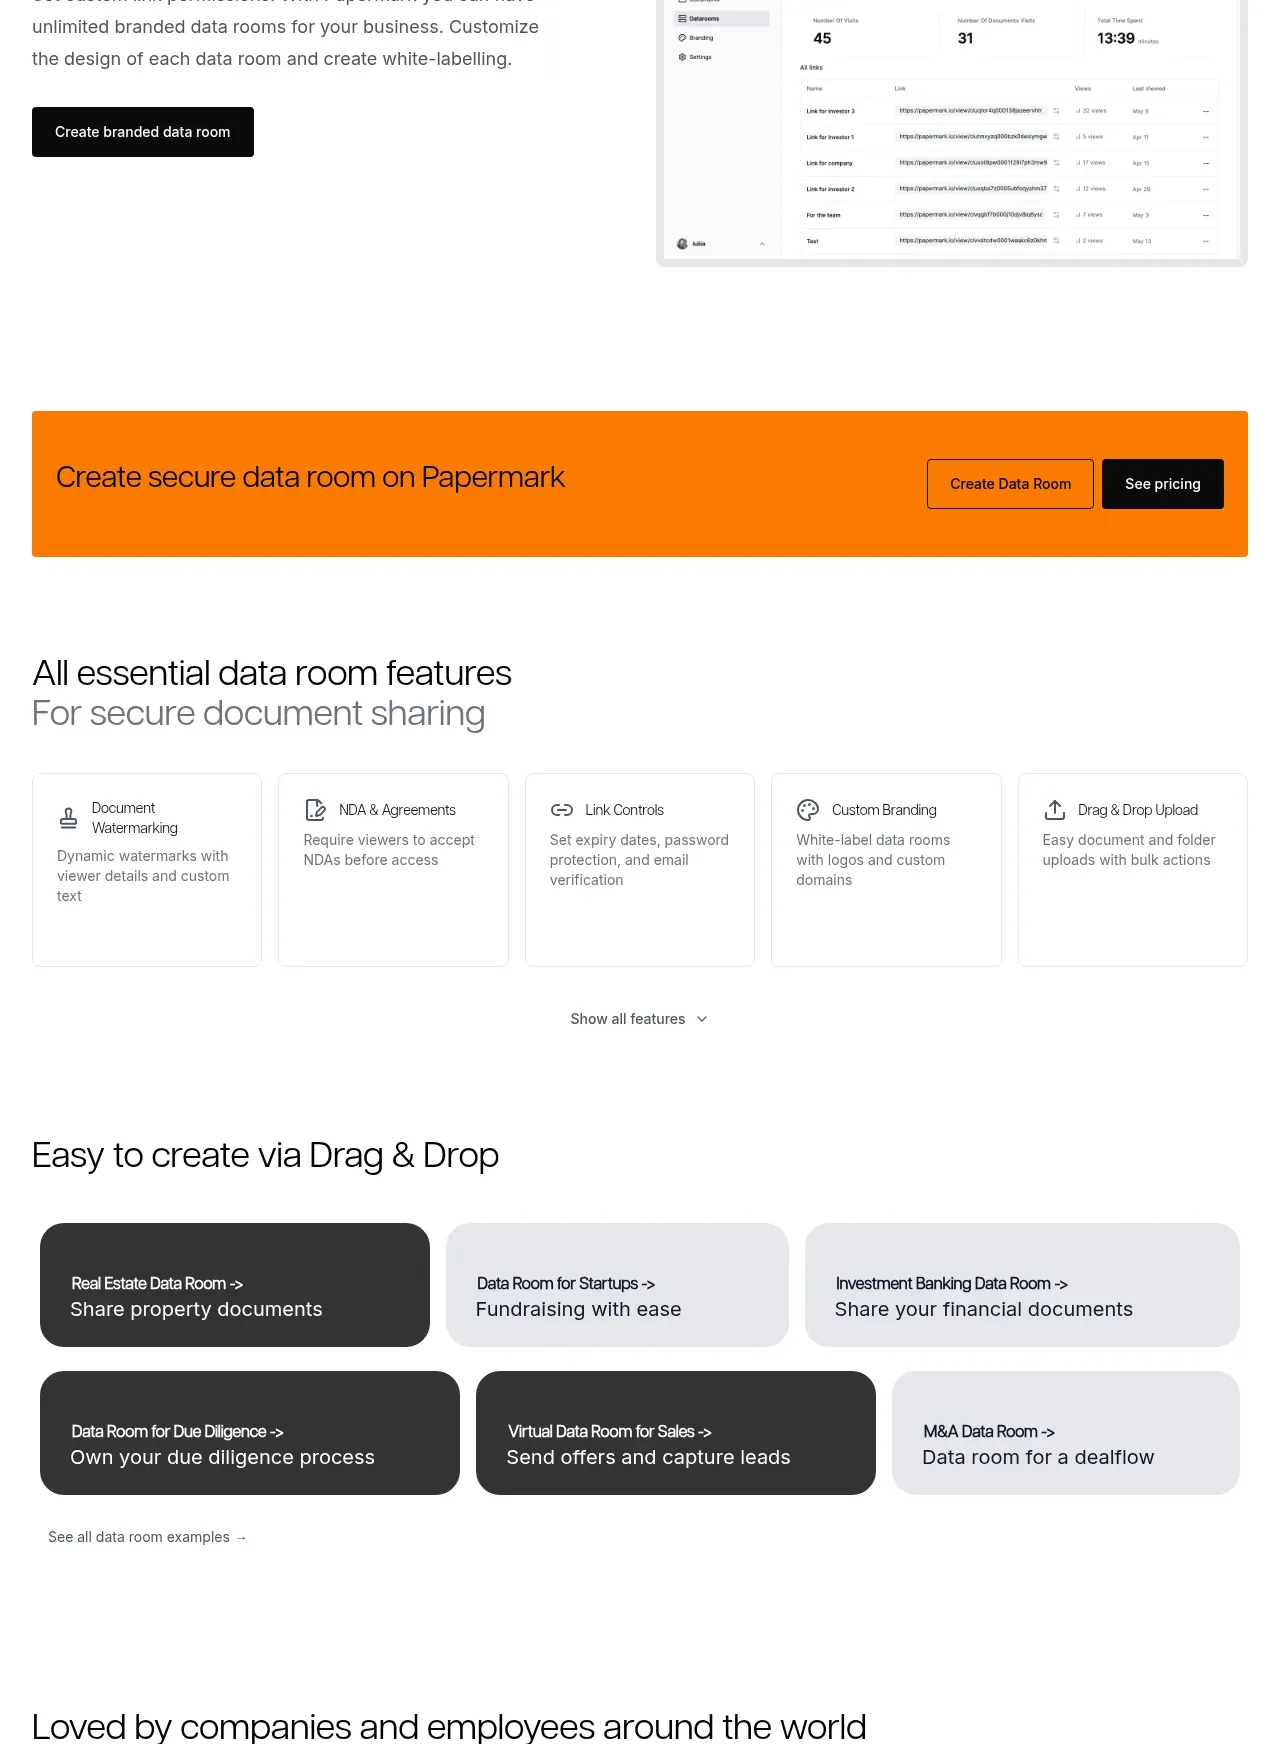
 Workflow demonstrations
Papermark Data Rooms · Feature grid
Workflow demonstrations
Papermark Data Rooms · Feature grid
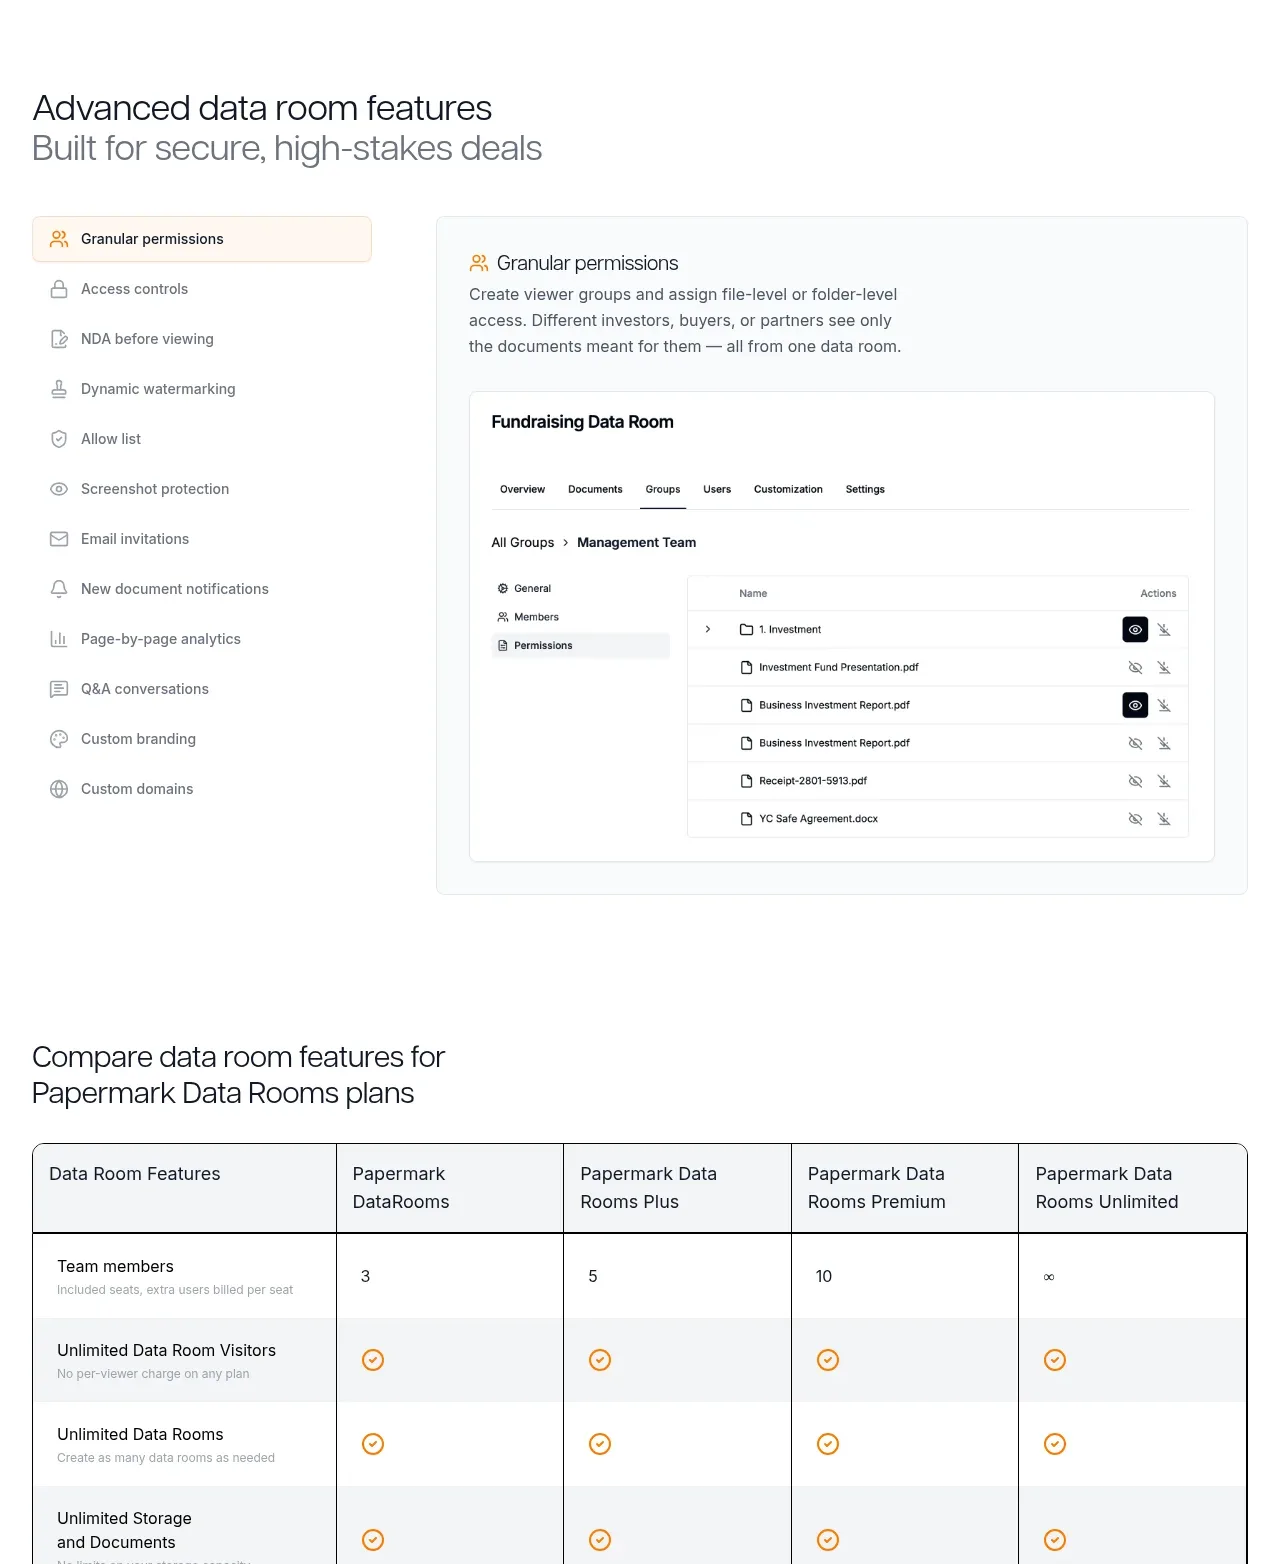 Advanced data-room features
Papermark Data Rooms · Feature grid
Advanced data-room features
Papermark Data Rooms · Feature grid
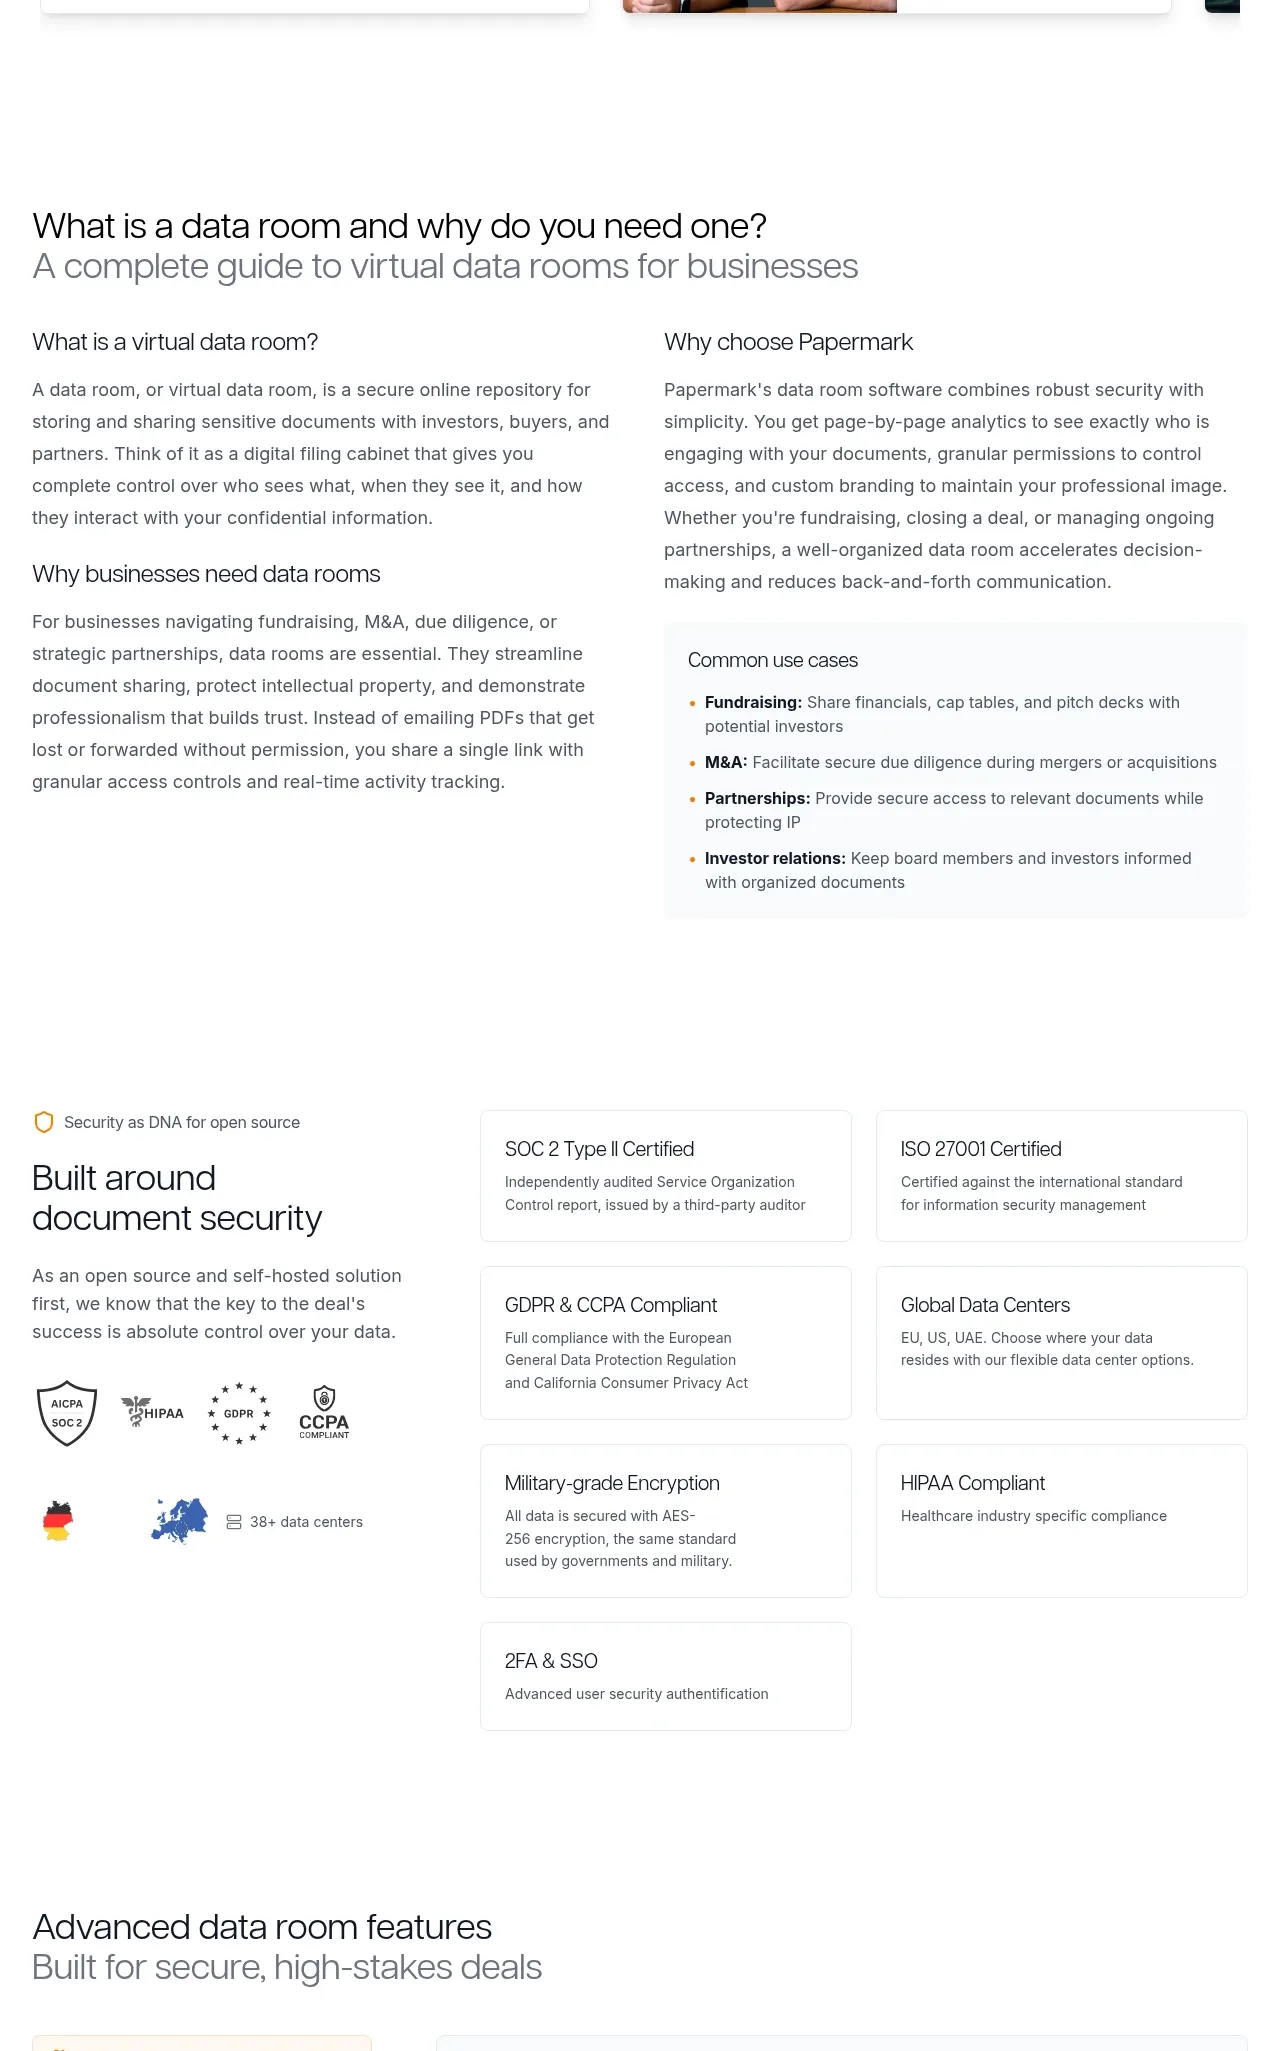 Data-room education and security overview
Papermark Data Rooms · Feature grid
Data-room education and security overview
Papermark Data Rooms · Feature grid
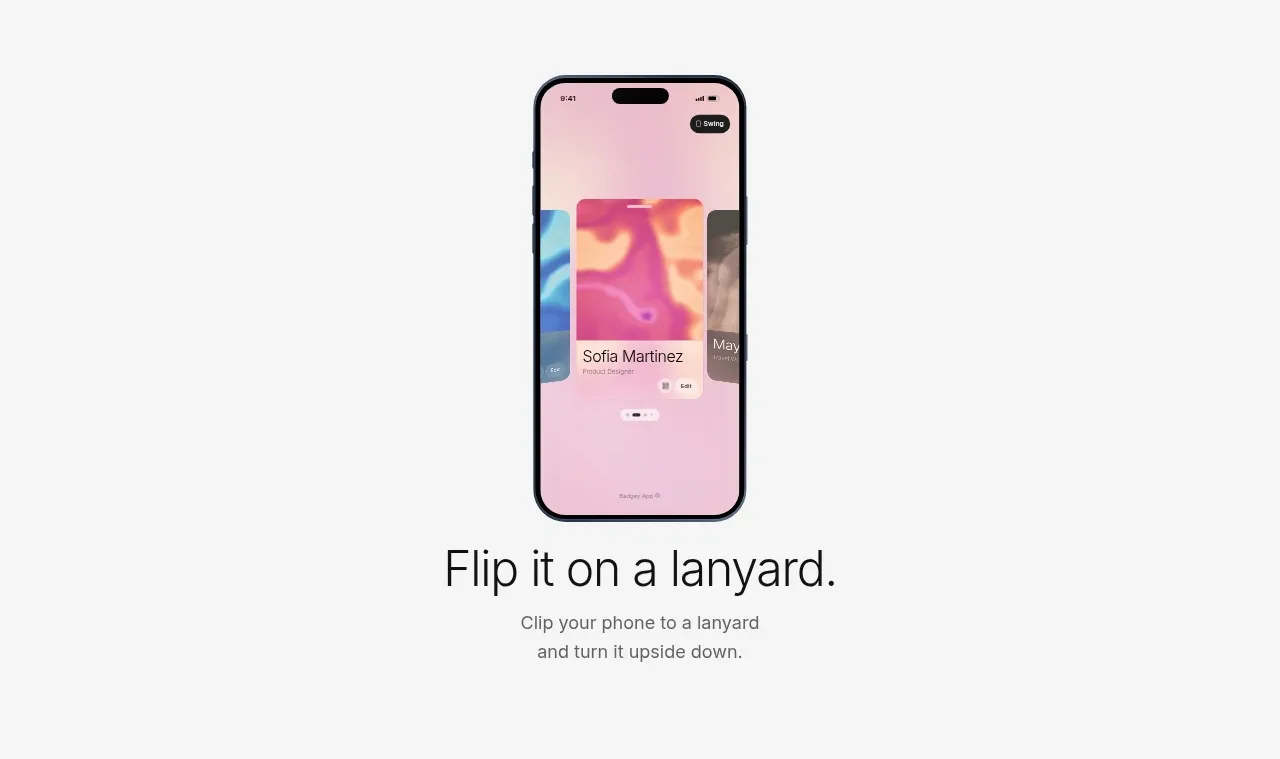
 Lanyard use-case feature
Badgey · Feature grid
Lanyard use-case feature
Badgey · Feature grid
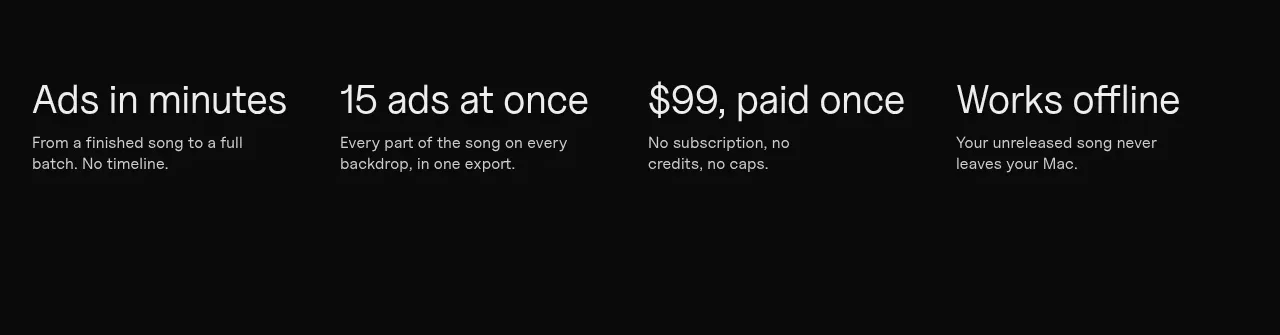
 Four value propositions
Clips by Plastic · Feature grid
Four value propositions
Clips by Plastic · Feature grid
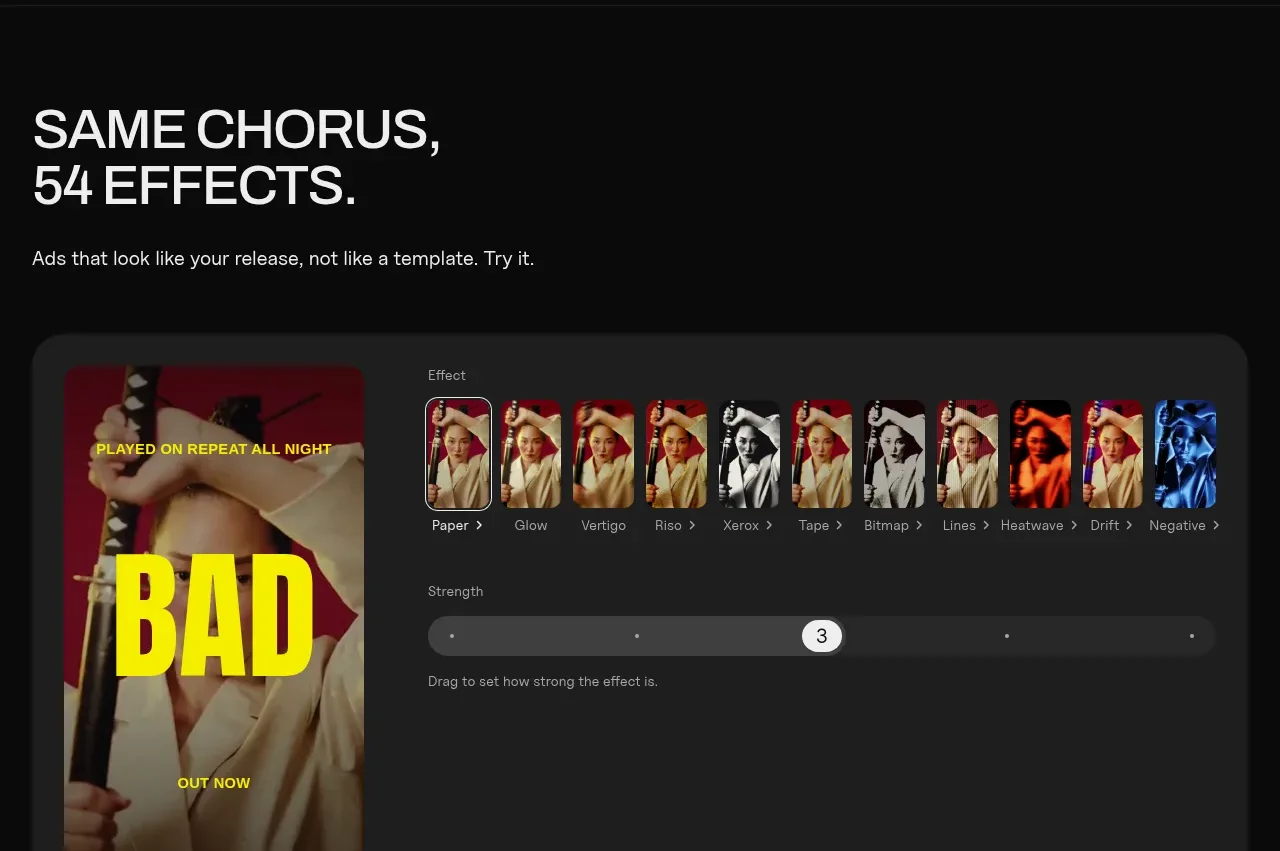 Effects and customization panel
Clips by Plastic · Feature grid
Effects and customization panel
Clips by Plastic · Feature grid