kage
krea.ai
Design analysis
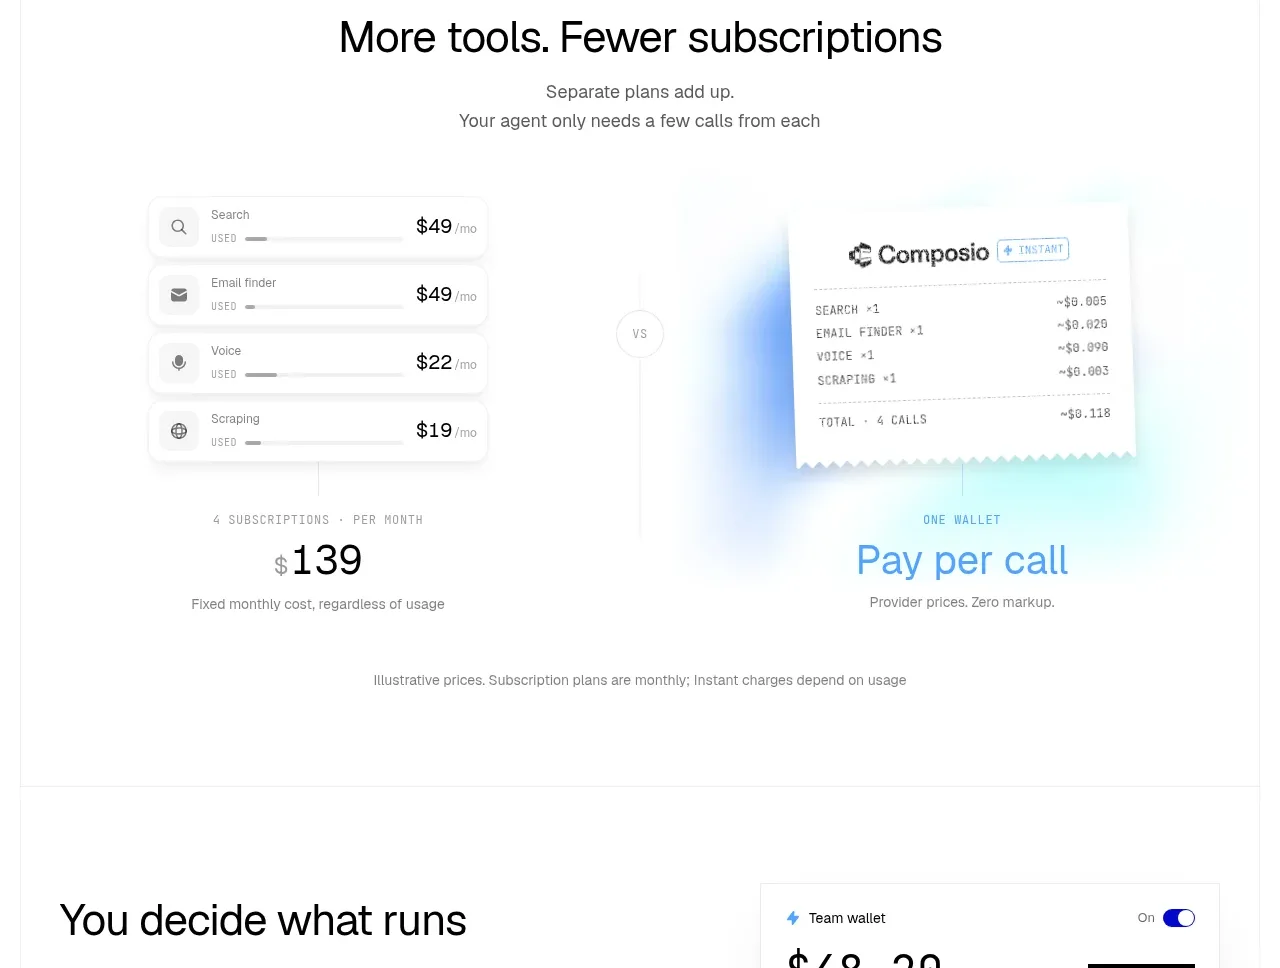
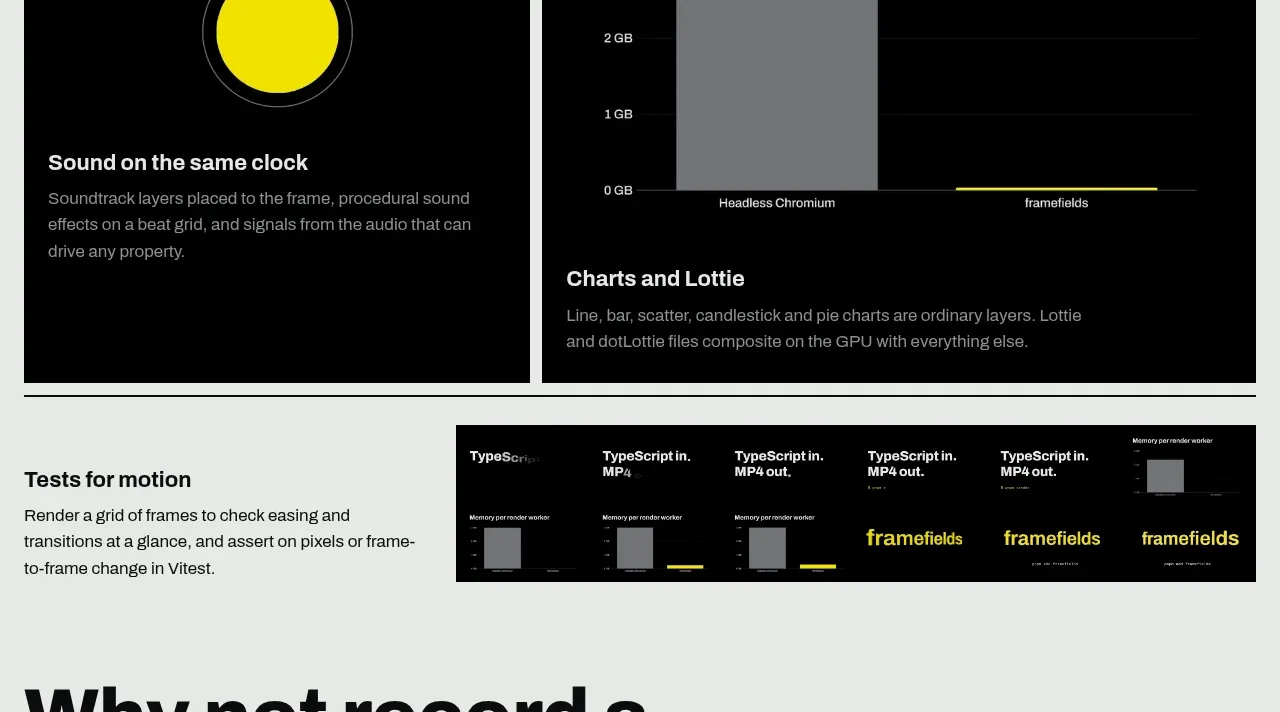
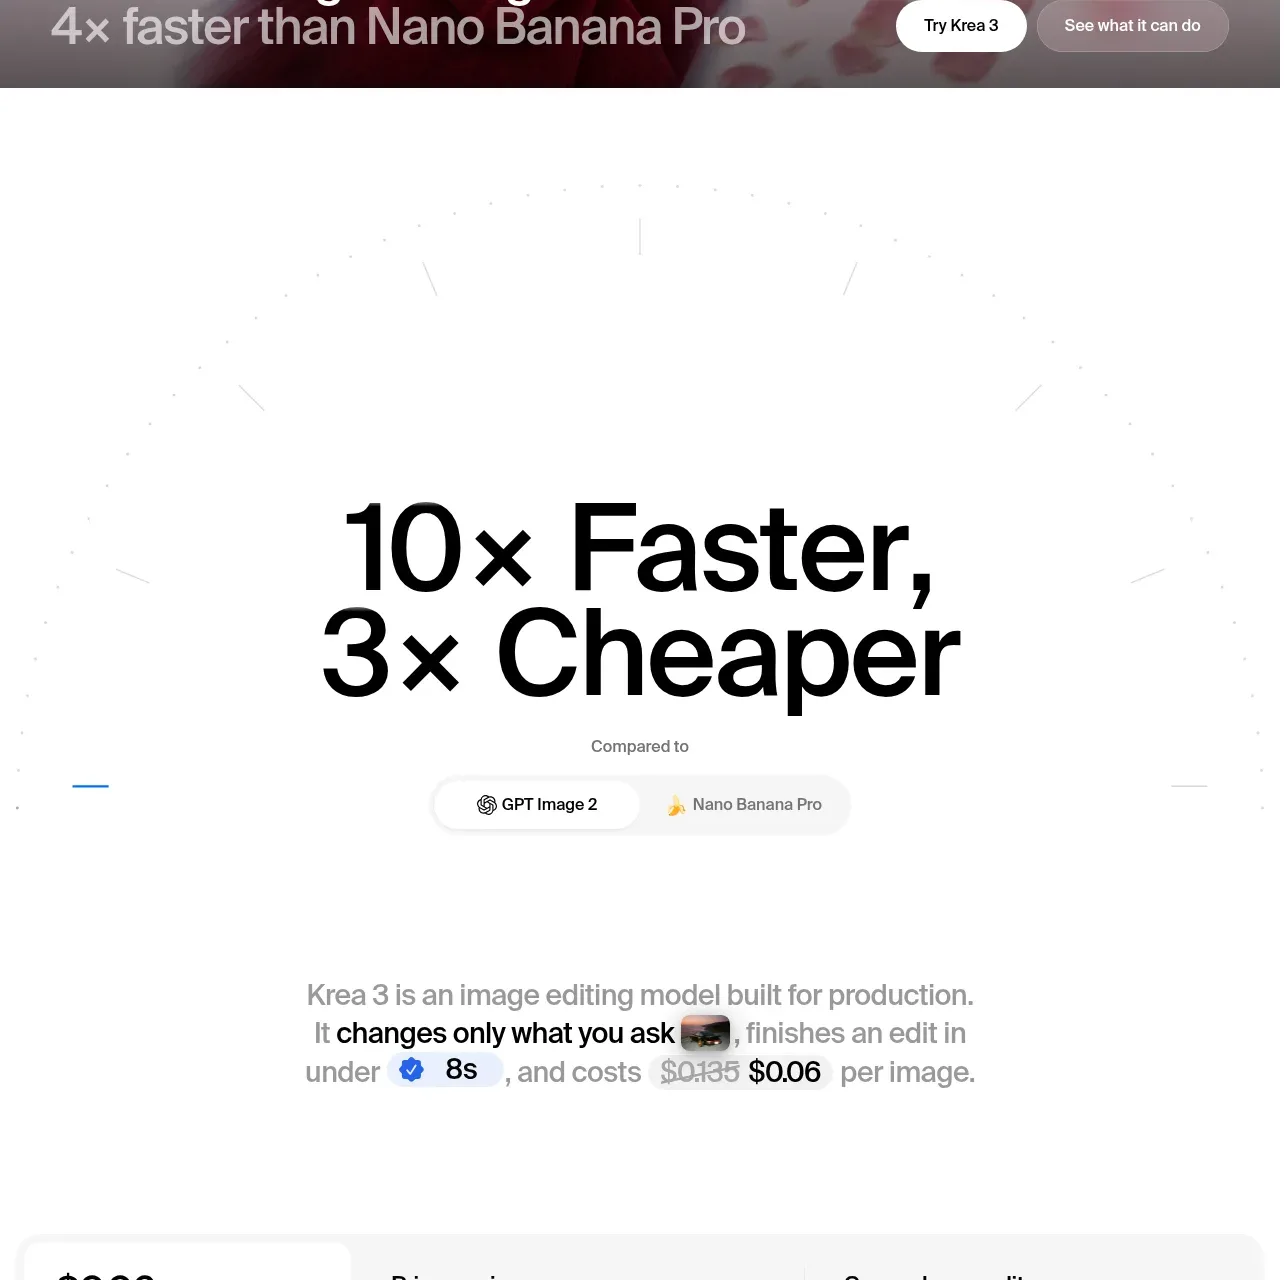
A large numeric claim is followed by concise explanatory copy and a comparison panel that makes speed and price differences scannable.
Prompt preview
## Reference images

Study these alongside the description below: hierarchy, rhythm, spacing, colour. Build for the product you are asked about, using this design language.

- Component: https://kage-design-assets.t3.tigrisfiles.io/components/krea-3/dbe75373-d211-428a-9d9b-aa6c396006bc-1792389811-2.webp
- Full page it was cut from: https://kage-design-assets.t3.tigrisfiles.io/screenshots/krea-3/dbe75373-d211-428a-9d9b-aa6c396006bc-1792389704928-full.webp
- Component on Kage: https://kage.design/component/krea-3-stats

## Before you start
Ask what the user's product and brand are, then apply the following principles to their proof section rather than copying this reference.

Build a centered proof section on a warm white background with generous vertical whitespace. Start with an oversized two-line statistic, roughly 56–76px, using near-black #090909 and tight tracking. Add a short centered paragraph below in 15–17px gray #777, with one or two emphasized inline values. Follow it with a rounded comparison card: a compact metric tile on the left and two or three aligned comparison columns on the right. Use #f7f7f5 surfaces, white inset cards, 1px #e8e8e5 borders, 12–16px radius, subtle shadow, and thin progress bars or sparklines in a restrained blue accent such as #3b6eea. Make labels small and numbers bold; support responsive stacking on mobile.

Never:
- use the reference logo or product name
- copy its statistics, competitor names, or copy
- reuse its imagery or illustration
- reproduce the exact layout or visual assets