kage
mylens.ai
Design analysis
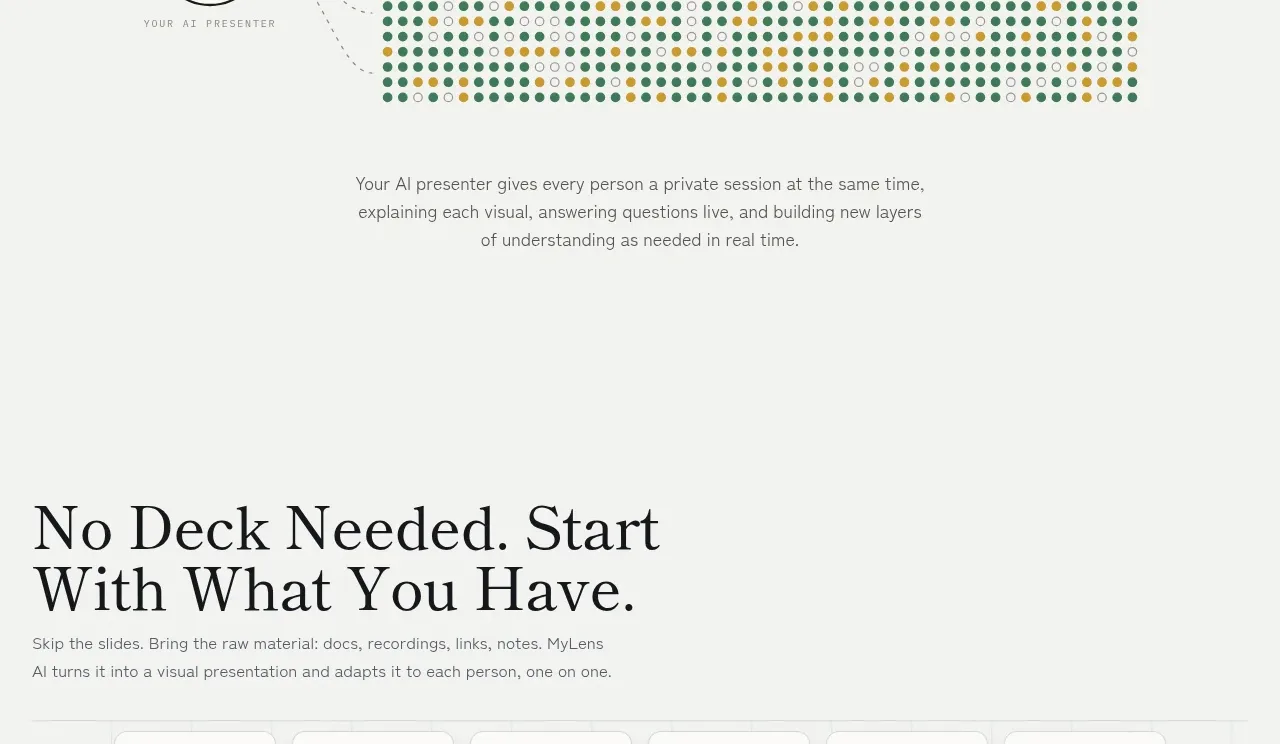
A restrained visual statistic turns the product promise into a memorable one-to-many relationship: a single presenter node expands into a large field of audience dots, followed by a short explanatory sentence.
Prompt preview
## Reference images

Study these alongside the description below: hierarchy, rhythm, spacing, colour. Build for the product you are asked about, using this design language.

- Component: https://kage-design-assets.t3.tigrisfiles.io/components/mylens/1ccd9fd0-0589-4047-afdb-6c3bf2f362f8-1792389752-3.webp
- Full page it was cut from: https://kage-design-assets.t3.tigrisfiles.io/screenshots/mylens/1ccd9fd0-0589-4047-afdb-6c3bf2f362f8-1792389647544-full.webp
- Component on Kage: https://kage.design/component/mylens-stats

## Before you start
Ask what scale or transformation the user's product should communicate. Build an original visual statistic that makes that relationship immediately understandable.

Create a centered scale section with a small uppercase label, a horizontal visual showing one origin node flowing into a large patterned field of small audience/status dots, and a concise explanatory sentence underneath. Make the number or relationship the visual focus without adding unnecessary charts or controls.

Design rules:
- Use the same warm off-white background, with forest green around `#4d806b`, muted gold around `#c6a63c`, and gray-green for secondary dots.
- Use large serif numerals or labels around 64–88px and understated monospace or uppercase microcopy around 9–11px.
- Keep the visual horizontally centered with generous top and bottom whitespace.
- Use tiny 5–8px circles, mixed filled/outlined states, and very fine connectors to show expansion.
- Add a short centered sans-serif explanation at 13–15px, maximum width about 430px.

Never:
- Never use logos, product names, copy, illustrations, or imagery from the reference.
- Never reuse the exact numeric claim, dot arrangement, or presenter icon.
- Never turn this into a misleading quantitative chart without labels or context.