 kage
kage
monzo.com

Design analysis
A calm, editorial two-column section pairs a strong explanatory content column with stacked, highly legible data cards. The contrast between spacious typography and compact ranking visuals makes complex proof points easy to scan without feeling like a dashboard.
Prompt preview
## Reference images

Study these alongside the description below: hierarchy, rhythm, spacing, colour. Build for the product you are asked about, using this design language.

- Component: https://kage-design-assets.t3.tigrisfiles.io/components/monzo-com/b864c421-0184-411c-901f-a4ffc676dbcc-1789060822-10.webp
- Full page it was cut from: https://kage-design-assets.t3.tigrisfiles.io/screenshots/monzo-com/b864c421-0184-411c-901f-a4ffc676dbcc-1789060760-full.webp
- Component on Kage: https://kage.design/component/monzo-feature-grid-6

## Before you start
Ask the user what their product is, who it is for, and what their brand personality, colours, typography, and content are. Then apply the principles below to create an original feature-grid section for that product—not a copy of the reference.

## Build this section
Create a responsive editorial feature grid that presents a headline feature alongside a vertical stack of supporting metric or proof cards. The section should feel trustworthy, spacious, approachable, and information-rich without becoming a dense dashboard.

### Layout and alignment
- Use a wide, centred content container with generous horizontal margins; target a maximum width of roughly 1180–1280px.
- On large screens, use a two-column grid: a left content column around 45–50% wide and a right column around 45–50% wide. Keep the columns top-aligned.
- Let the left column introduce the topic with an optional small metadata label, a large headline, a coloured subheading, and a concise explanatory paragraph.
- Stack two or more supporting cards in the right column with a generous vertical gap. Each card should be self-contained and easy to scan.
- On smaller screens, collapse to one column. Put the introductory content first, followed by the cards; avoid squeezing the ranking or metric rows horizontally.
- Within each card, align the title, description, data label, visual comparison rows, and CTA to one consistent left edge.
- Use whitespace as the primary grouping mechanism rather than visible separators between the left content and right cards.

### Typography hierarchy
- Use the product’s display or heading face for the main headline: bold, compact, and highly legible, approximately 42–52px on desktop with a tight line-height around 0.98–1.05.
- Use a smaller metadata pill or label at approximately 14–16px with medium weight.
- Make the coloured subheading approximately 22–26px and bold enough to establish the topic immediately.
- Use body copy around 16–18px with a 1.35–1.5 line-height and a muted colour for comfortable reading.
- Inside cards, use a compact eyebrow or location/category label around 15–17px, a coloured card title around 20–24px, and supporting copy around 16–18px.
- Make data values, ranks, or names visually prominent but subordinate to the card title. Use tabular numerals where possible.
- Keep button text short, bold, and around 15–16px.

### Colour
- Start with a warm or neutral page background, approximately #FFFFFF or #FCFCFA.
- Use a very dark blue-black for primary text, approximately #10202B or #11232D.
- Use a muted grey for supporting copy, approximately #687176.
- Give the cards a very pale tinted surface—such as a cool mint or product-specific soft tint around #F0F7F4—so they are distinct without looking boxed in.
- Choose one warm accent for section headings, ranking labels, fills, and percentage outlines, approximately #C94718 to #D95A39. Adapt this accent to the user’s brand.
- Use a darker, high-contrast colour for primary buttons, approximately #10232F, with near-white text.
- Ensure all text and controls meet accessible contrast requirements; do not rely on colour alone to communicate rank or status.

### Cards and data visualisation
- Give each card generous internal padding, approximately 32–40px on desktop and 24px on mobile.
- Use a large, soft corner radius around 32–40px. Avoid hard shadows; if separation is needed, use a subtle border such as rgba(16,32,43,.06).
- Represent comparisons with compact horizontal rows: a rank marker, a label or name, a simple progress/bar shape, and a percentage or outcome value.
- Keep row heights consistent and use light neutral tracks with accent fills. Highlight the primary or featured result through typography and colour rather than excessive decoration.
- Use outlined circular rank markers and outlined value badges when appropriate, keeping strokes thin and consistent.
- If the user’s content is not comparative, translate the same structure into stat rows, milestones, ratings, or feature outcomes rather than inventing rankings.
- Keep all values readable at mobile widths and provide text equivalents or accessible labels for visual bars.

### Interaction
- Make each CTA a rounded, pill-shaped button with generous horizontal padding and a clear focus ring.
- Add subtle hover and pressed states: slightly darken or brighten the button, and optionally raise the card by 1–2px, but avoid distracting animation.
- If cards link to detailed reports or feature pages, make the link target clear and include descriptive accessible labels.
- Use a short, smooth transition around 150–220ms; respect reduced-motion preferences.

### Responsive and accessibility requirements
- Preserve the reading order: introductory content, then supporting cards, then each card’s data and CTA.
- Allow headings to wrap naturally; never force clipped text or horizontal scrolling.
- Use semantic headings, lists for repeated data rows, real buttons or links, visible keyboard focus, and sufficient touch targets.
- Check the layout at narrow mobile widths and at large desktop widths so the cards do not become excessively tall or the left column too sparse.

## Never
- Never reuse the reference’s logos, product names, competitor names, exact copy, rankings, percentages, labels, or dates.
- Never copy the reference’s illustrations, imagery, brand marks, or distinctive proprietary graphic assets.
- Never reproduce the exact card content or visual arrangement if it would make the section feel like a clone; adapt the pattern to the user’s product and information.
- Never use decorative charts that obscure the underlying data or depend only on colour.
- Never sacrifice readability, responsiveness, or accessibility for visual similarity.
More components
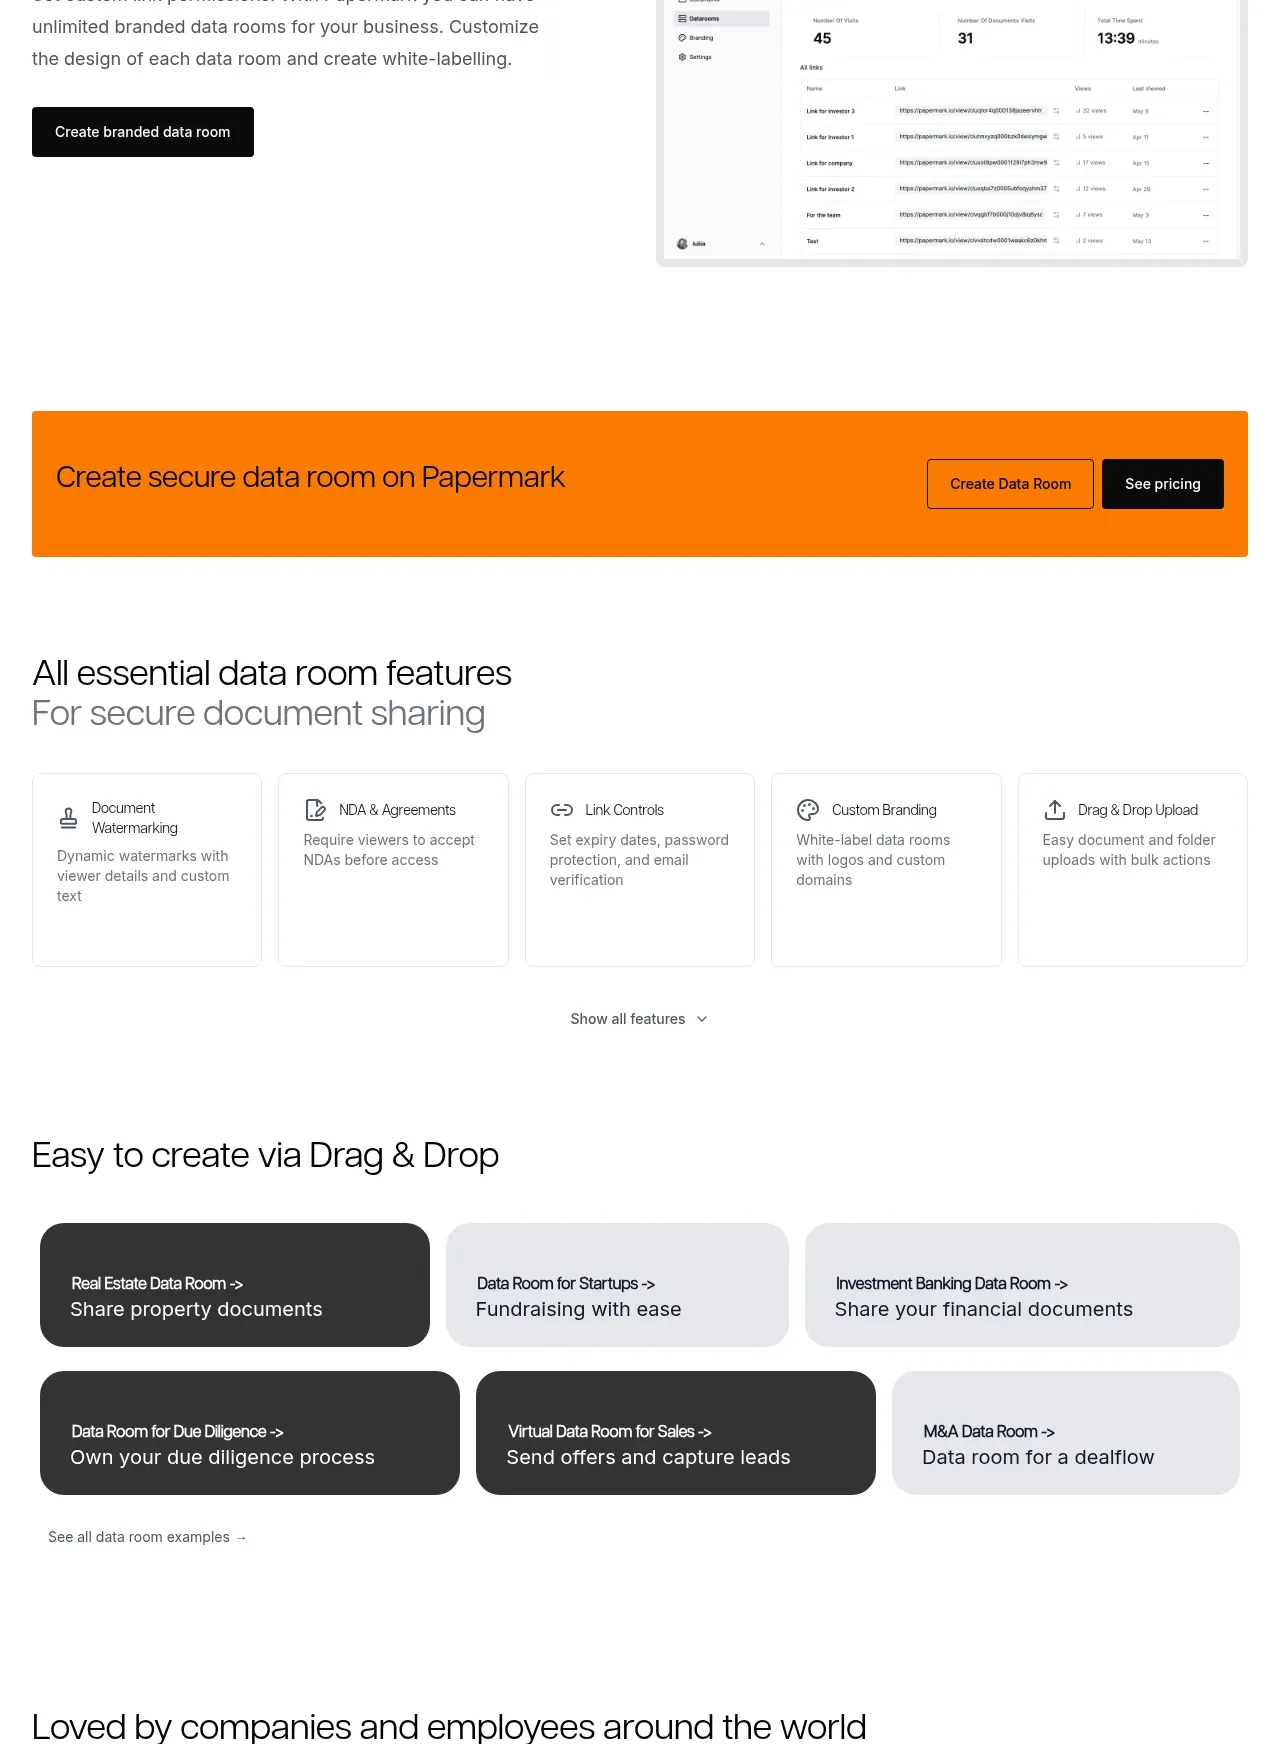
 Workflow demonstrations
Papermark Data Rooms · Feature grid
Workflow demonstrations
Papermark Data Rooms · Feature grid
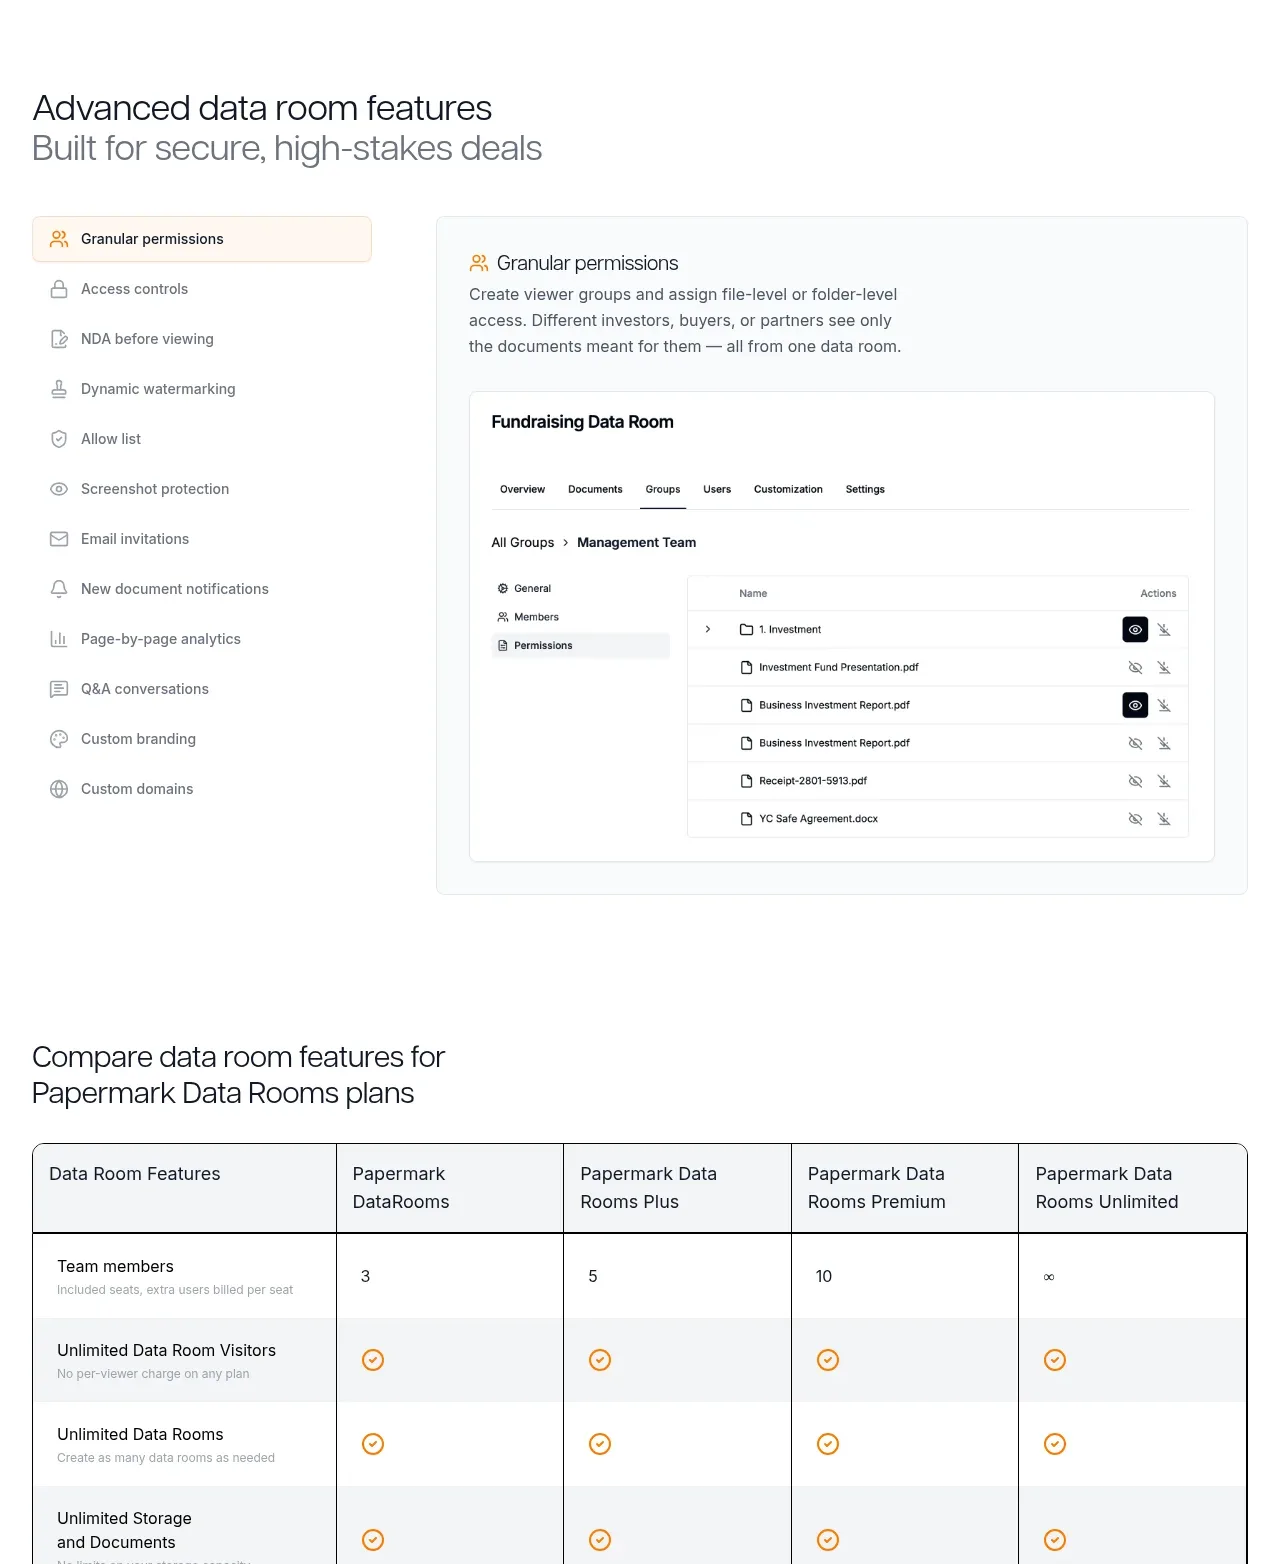 Advanced data-room features
Papermark Data Rooms · Feature grid
Advanced data-room features
Papermark Data Rooms · Feature grid
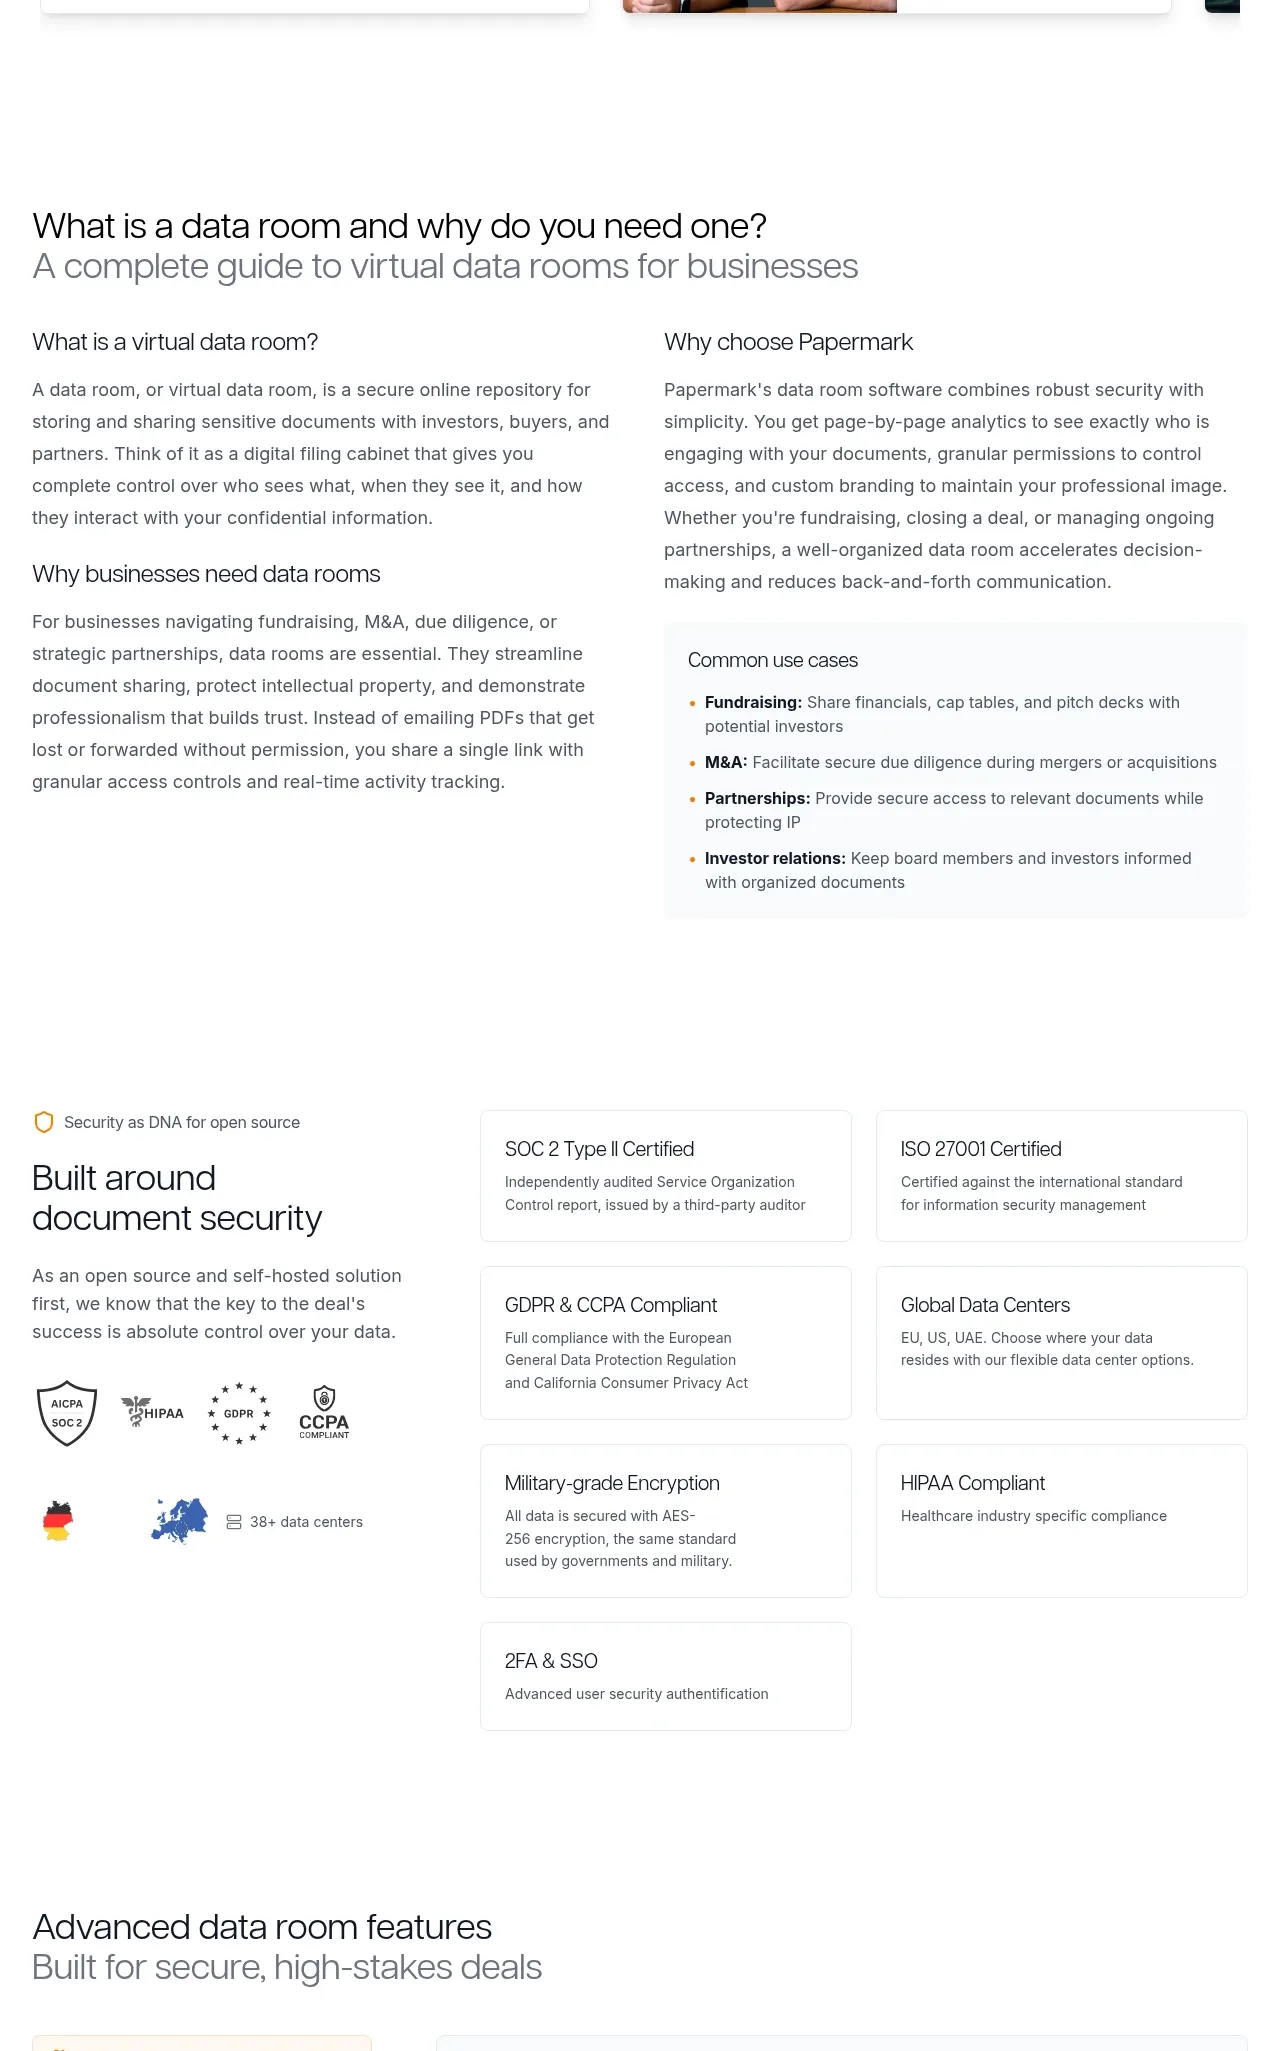 Data-room education and security overview
Papermark Data Rooms · Feature grid
Data-room education and security overview
Papermark Data Rooms · Feature grid
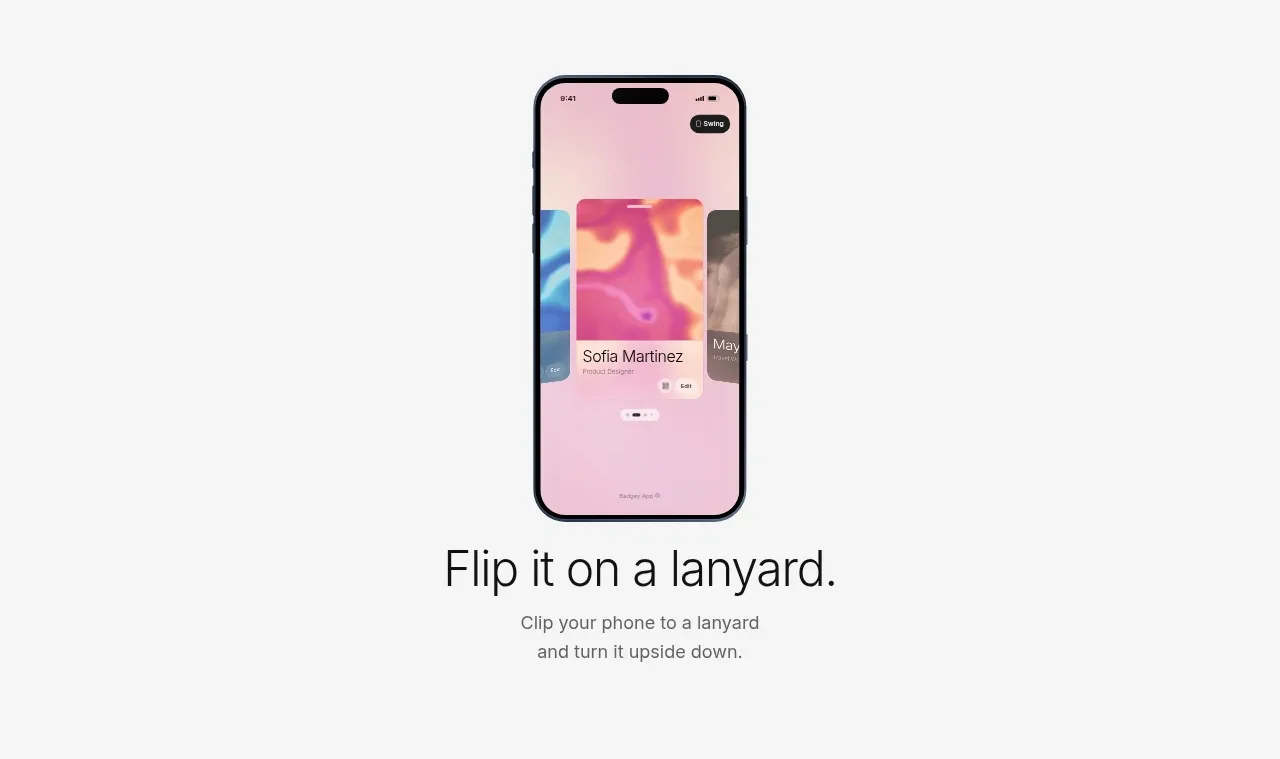
 Lanyard use-case feature
Badgey · Feature grid
Lanyard use-case feature
Badgey · Feature grid

 Four value propositions
Clips by Plastic · Feature grid
Four value propositions
Clips by Plastic · Feature grid
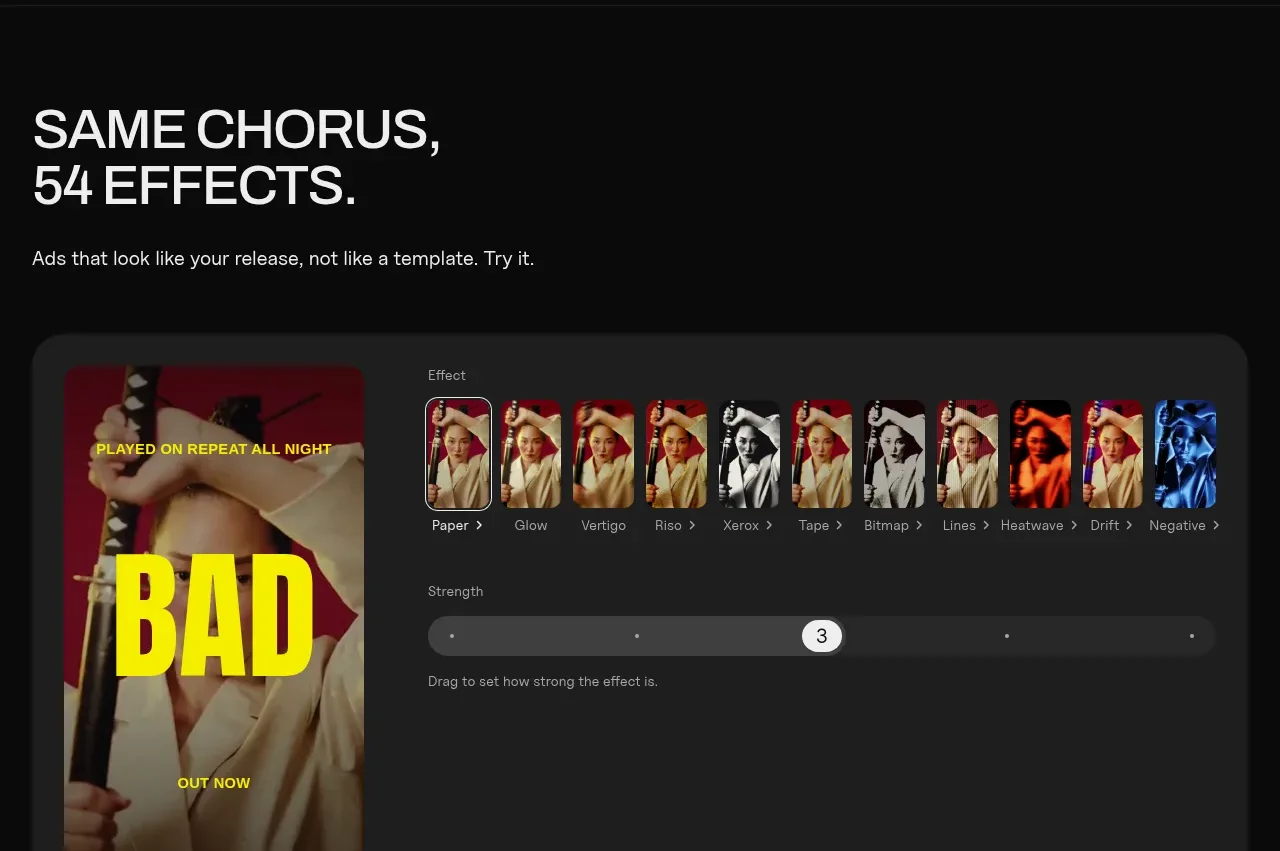 Effects and customization panel
Clips by Plastic · Feature grid
Effects and customization panel
Clips by Plastic · Feature grid