 kage
kage
neon.tech

Design analysis
A pale contrasting feature band introduces autoscaling with a centered headline, a small two-state control, and a comparative performance chart with legend and explanatory copy.
Prompt preview
## Reference images

Study these alongside the description below: hierarchy, rhythm, spacing, colour. Build for the product you are asked about, using this design language.

- Component: https://kage-design-assets.t3.tigrisfiles.io/components/neon-tech/ec270806-81ac-4f67-8b23-bd56e790768f-1789141961-4.webp
- Full page it was cut from: https://kage-design-assets.t3.tigrisfiles.io/screenshots/neon-tech/ec270806-81ac-4f67-8b23-bd56e790768f-1789139044100-full.webp
- Component on Kage: https://kage.design/component/neon-feature-grid-2

## Before you start
Ask what the user's product and brand are, then apply these principles to their identity rather than reproducing this reference.

Build a light feature band with a pale mint background #e4f2ed and dark text. Center a small dotted accent above a 42–50px headline, using dark text for the claim and gray for the supporting sentence. Add a compact segmented control with two states, then a wide comparison chart: two adjacent panels or halves, fine grid lines, contrasting filled area graphs, labels, and a legend below. Keep the chart editorial and data-led rather than decorative. Use #17201e, #6d7773, #35aa83, #d65e68, #c8d7d1, 1px borders, and squared or lightly rounded controls. Make the segmented control update the chart state.

Never: use logos, product names, copy, illustrations, or imagery from the reference.
More components
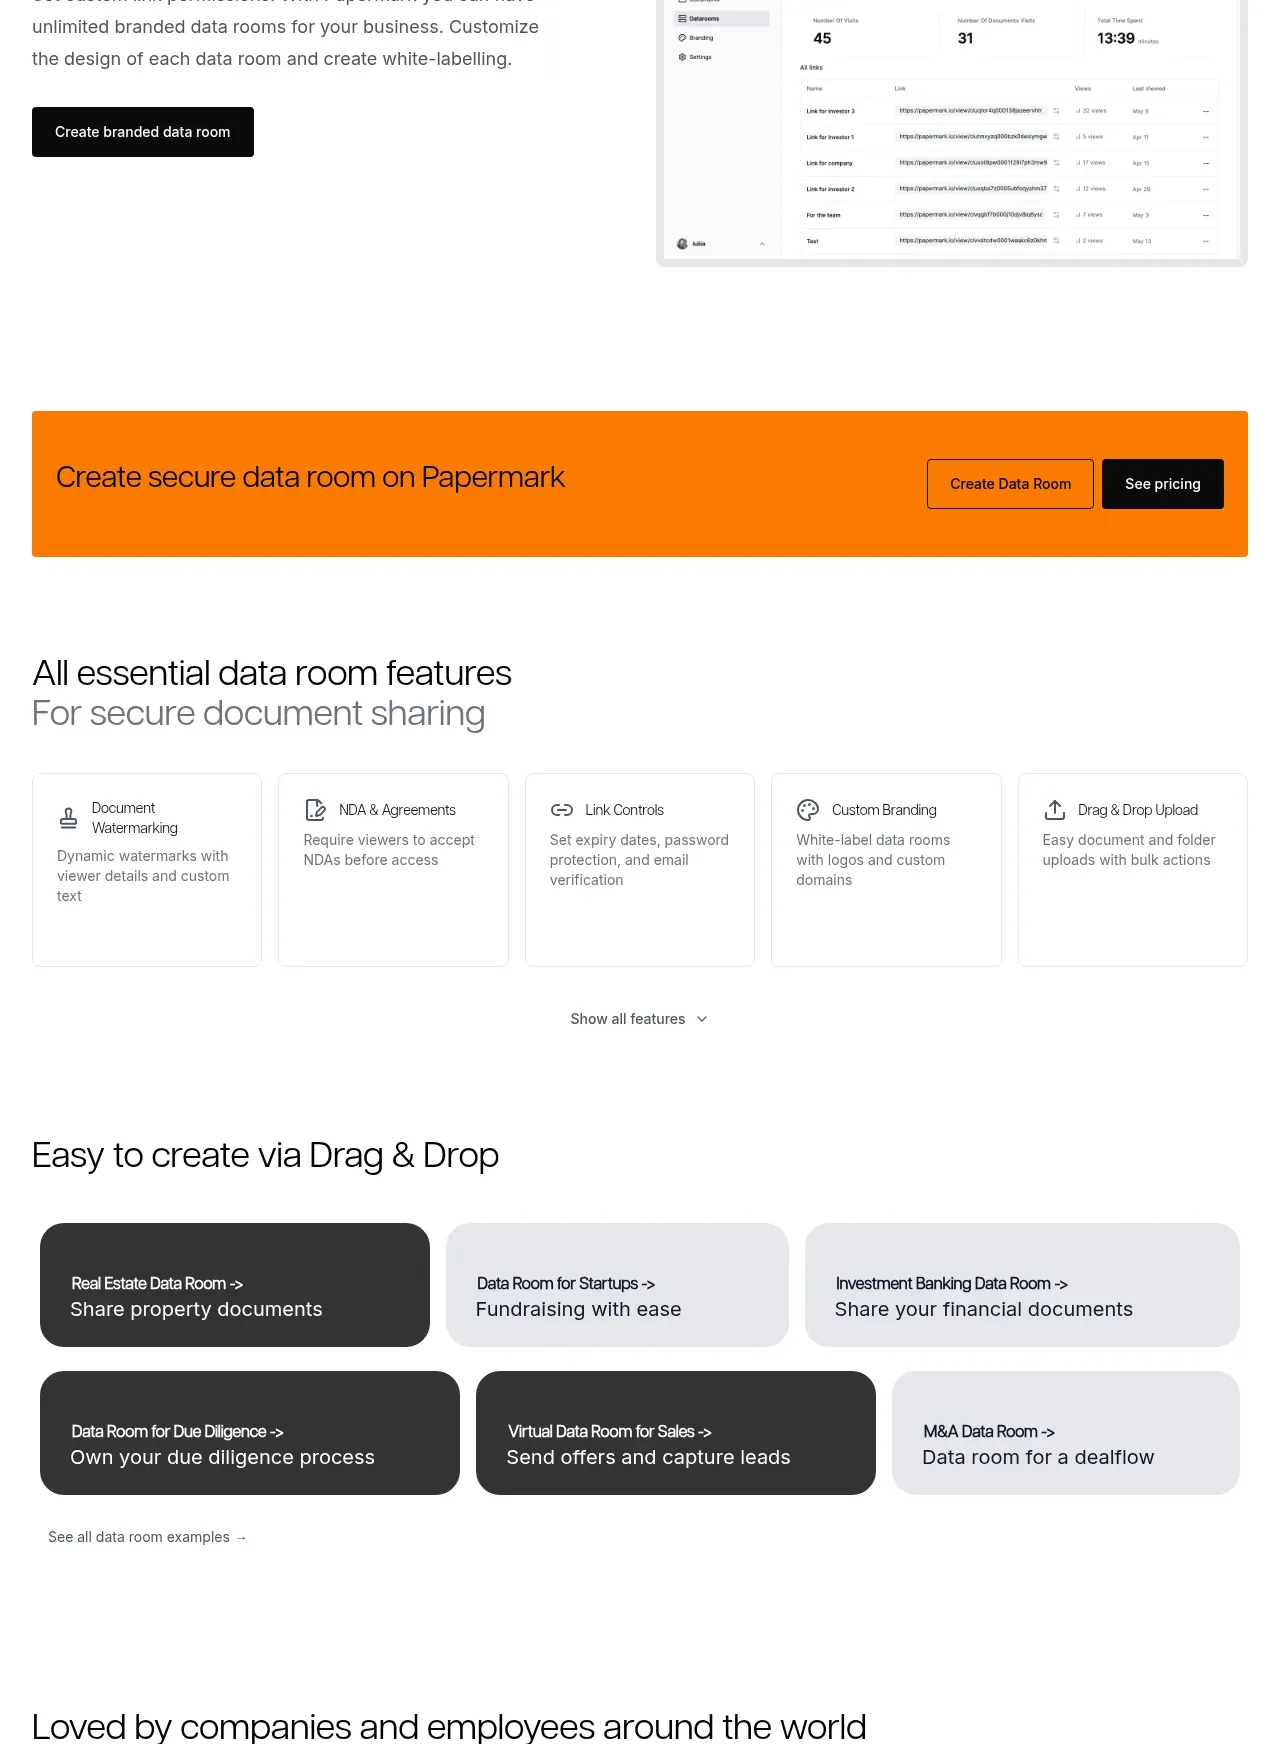
 Workflow demonstrations
Papermark Data Rooms · Feature grid
Workflow demonstrations
Papermark Data Rooms · Feature grid
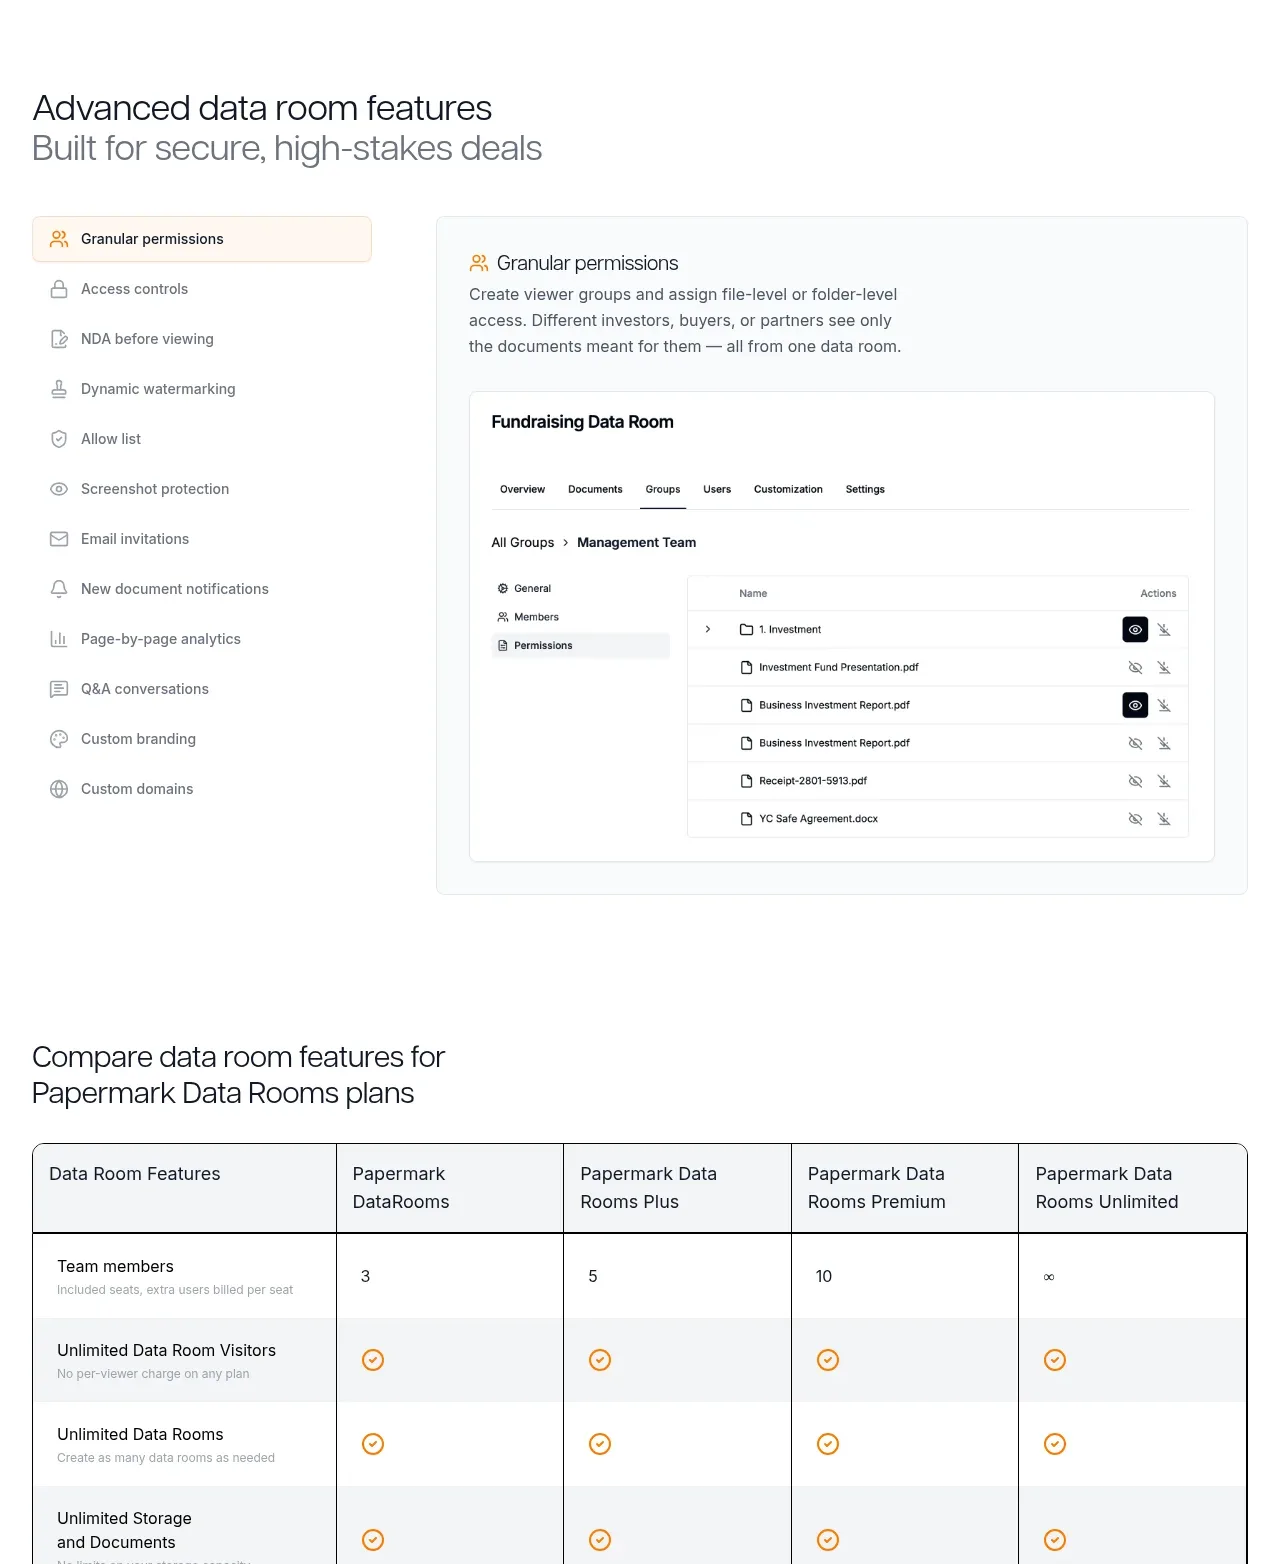 Advanced data-room features
Papermark Data Rooms · Feature grid
Advanced data-room features
Papermark Data Rooms · Feature grid
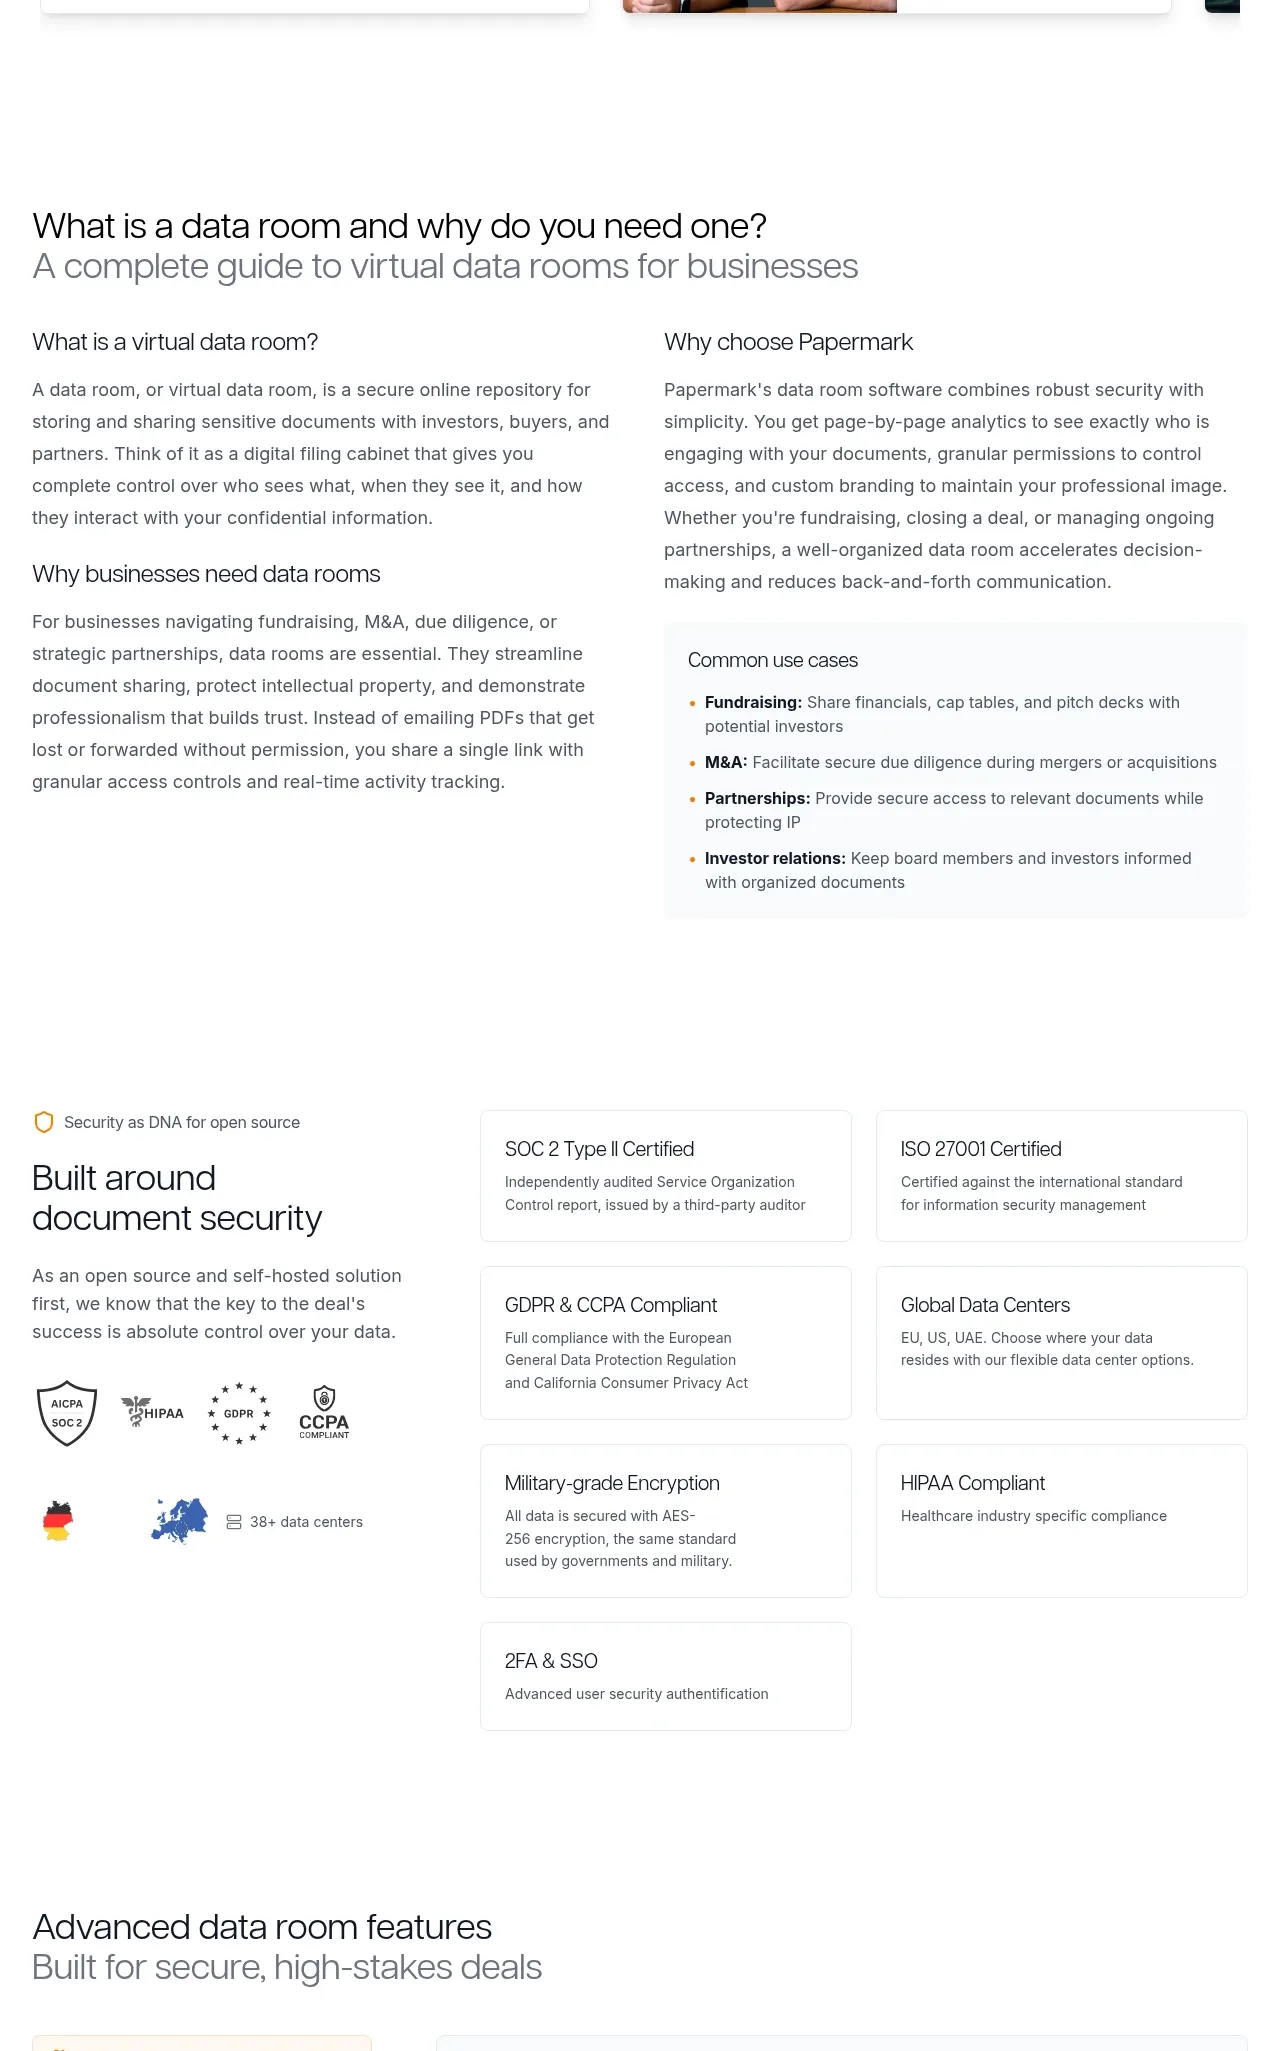 Data-room education and security overview
Papermark Data Rooms · Feature grid
Data-room education and security overview
Papermark Data Rooms · Feature grid
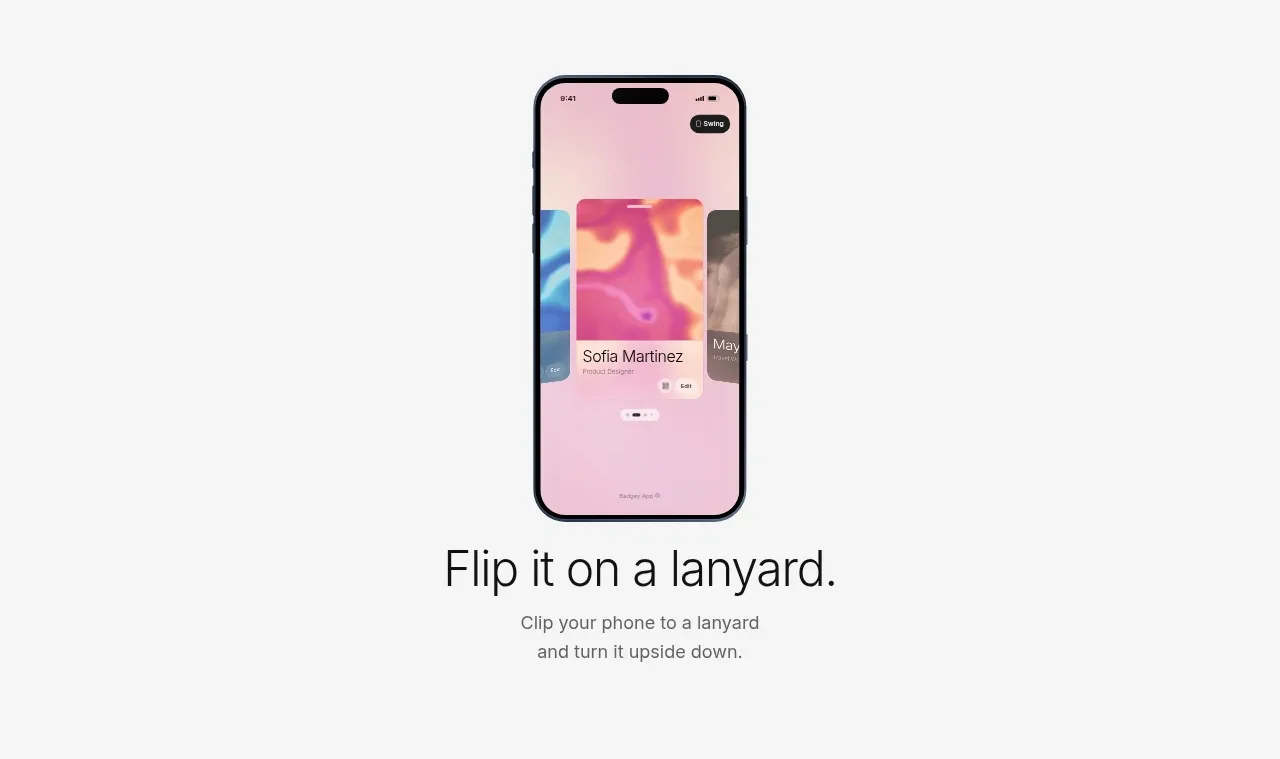
 Lanyard use-case feature
Badgey · Feature grid
Lanyard use-case feature
Badgey · Feature grid
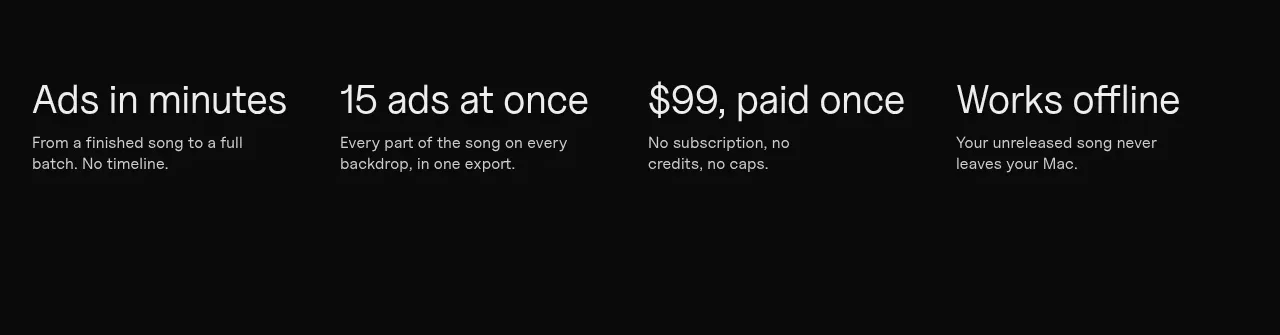
 Four value propositions
Clips by Plastic · Feature grid
Four value propositions
Clips by Plastic · Feature grid
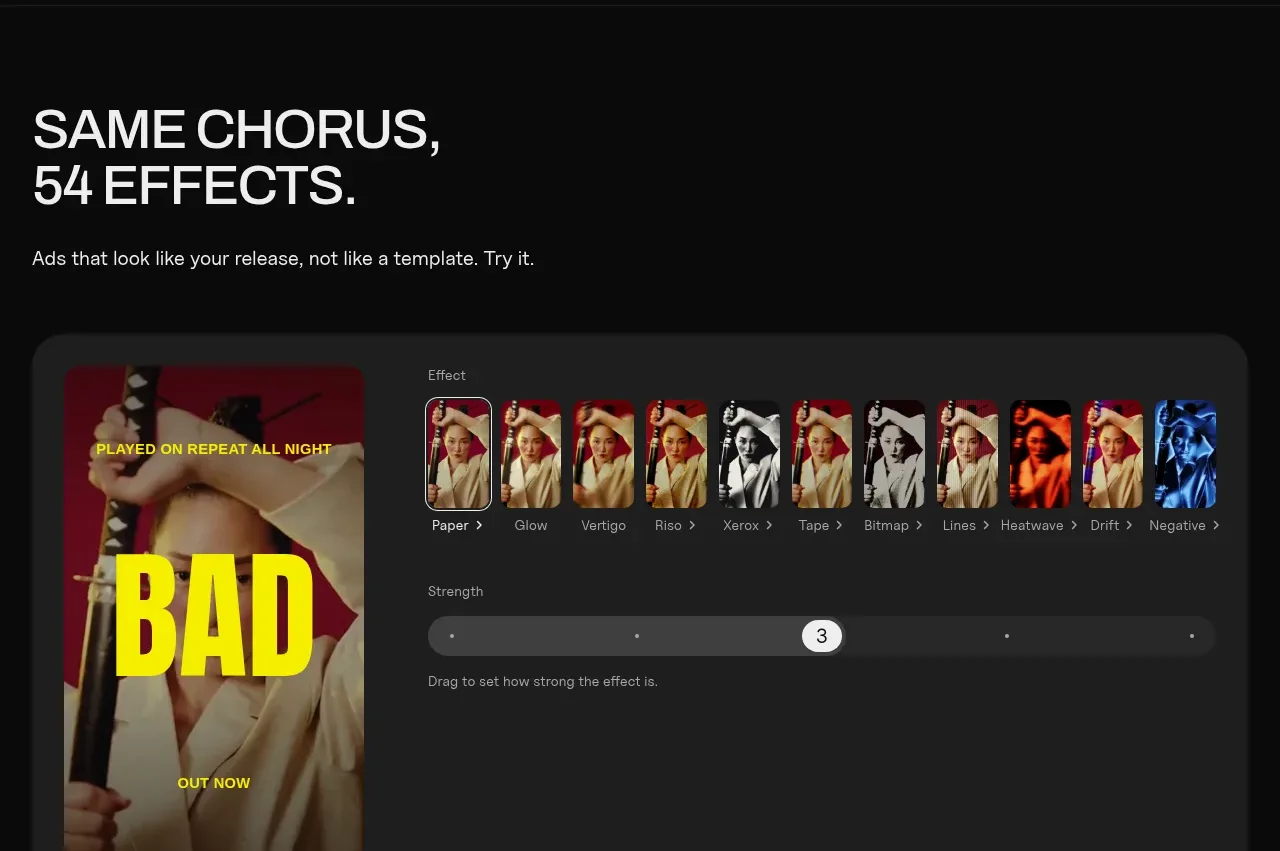 Effects and customization panel
Clips by Plastic · Feature grid
Effects and customization panel
Clips by Plastic · Feature grid