 kage
kage
bun.sh

Design analysis
A proof-oriented benchmark section that turns a complex performance comparison into six scannable scenario cards. Strong typography, compact bars, restrained colour, and small methodological notes make the results feel credible without overwhelming the reader.
Prompt preview
## Reference images

Study these alongside the description below: hierarchy, rhythm, spacing, colour. Build for the product you are asked about, using this design language.

- Component: https://kage-design-assets.t3.tigrisfiles.io/components/bun-sh/5fab2b15-2f70-4d99-a79d-411d5e236c09-1789073824-6.webp
- Full page it was cut from: https://kage-design-assets.t3.tigrisfiles.io/screenshots/bun-sh/5fab2b15-2f70-4d99-a79d-411d5e236c09-1789073774-full.webp
- Component on Kage: https://kage.design/component/bun-testimonials

## Before you start
Ask me what my product is, who it is for, and what its brand personality and visual system are. Then apply the principles below to create an original benchmark or proof section for that product—not a copy of the reference.

## Design language

Build a performance-proof section that presents multiple benchmark scenarios in a compact, editorial grid. The purpose is to help users quickly compare outcomes while still communicating that the measurements are credible and reproducible.

### Layout and alignment
- Use a wide, centered content container with a maximum width around 1120–1180px and generous horizontal padding of 32–64px.
- Start with a small overline label, then a large two-line headline, followed by a short explanatory paragraph.
- Place the primary and secondary actions in a horizontal row aligned to the right of the intro area on desktop; stack or left-align them on narrow screens.
- Below the intro, use a three-column grid of equal-width comparison cards and two rows on desktop. Collapse to two columns on tablets and one column on mobile.
- Keep all card content aligned to a consistent internal grid: title, muted scenario description, comparison bars, then a separated result/meta row.
- Add a small methodology note beneath the grid and a low-emphasis text link for reproducing or inspecting the benchmark.
- Preserve generous whitespace above and below the section so it reads as a distinct chapter of the page.

### Typography hierarchy
- Use a bold, condensed or tightly set sans-serif display face for the headline, with a large responsive size around 56–76px, tight line-height around 0.95–1.05, and slightly negative tracking.
- Use a compact uppercase or mono-style overline at 12–13px with increased letter spacing.
- Use a clear semibold sans-serif for card titles at 16–18px.
- Use a neutral sans-serif or mono-inspired small text style for scenario descriptions, labels, measurements, and methodological notes at 12–14px.
- Make the winning value visually prominent with a heavier weight and larger size than the comparison values.
- Use sentence case for headings and labels; reserve uppercase for the overline or technical metadata.

### Colour
- Use an almost-white or white page background, approximately #FFFFFF or #FAFAF9.
- Use near-black text around #111111 or #151515.
- Use soft neutral text around #6B6B6B for descriptions, comparison values, and footnotes.
- Use a restrained accent colour for the overline marker and result highlights, such as magenta #E62987, coral #F05A5A, electric blue #4F6BFF, or a brand-appropriate equivalent.
- Use black or very dark neutral bars for baseline comparisons, while the highlighted product row receives the accent marker or a distinctive treatment.
- Keep colour functional: it should identify the winner and hierarchy, not decorate every element.

### Borders, bars, and radius
- Use thin, low-contrast card borders around #DEDEDE or #E4E4E4.
- Keep cards nearly square with a subtle radius between 0 and 4px; avoid soft, floating dashboard cards.
- Inside each card, show four labelled horizontal comparison rows. Use a thin baseline or track and solid rectangular bars whose lengths communicate relative performance.
- Give the leading row a small accent marker or badge, but do not rely on colour alone; include explicit labels and values.
- Separate the bottom result/meta row with a thin horizontal rule.
- Use compact rectangular buttons with either a dark filled primary style or a white outlined secondary style, using a small radius of 0–3px.

### Interaction and responsive behaviour
- If the benchmark data is interactive, allow users to switch scenarios or comparison dimensions with keyboard-accessible controls while keeping the static grid understandable by default.
- Add hover and focus states to buttons and links using colour inversion, underline, or a subtle border change; provide visible keyboard focus rings.
- Preserve readable bar labels and exact values at every viewport size. On mobile, stack the cards and allow long methodology notes to wrap naturally.
- Do not animate bars in a way that delays access to the values; any entrance animation should be brief, optional, and respect reduced-motion preferences.
- Ensure sufficient colour contrast and provide text alternatives or accessible data tables for visual comparisons.

## Content guidance
Use the user's own product, competitors, metrics, scenarios, and claims. Each card should have a concise scenario title, one-line setup/context, a consistent set of comparison rows, a clear exact result, and a short takeaway such as a multiplier or resource saving. Include a brief note explaining the environment, sample size, and conditions so the section feels verifiable rather than promotional.

## Never
- Never use logos, product names, copy, illustrations, mascots, icons, or imagery from the reference.
- Never reproduce the reference benchmark values, scenario names, competitor names, or exact wording.
- Never make unsupported performance claims; use the user's real data or clearly labelled illustrative data.
- Never turn the section into a generic analytics dashboard with excessive controls, gradients, shadows, or decorative charts.
- Never rely on colour alone to communicate which result is best.
More components
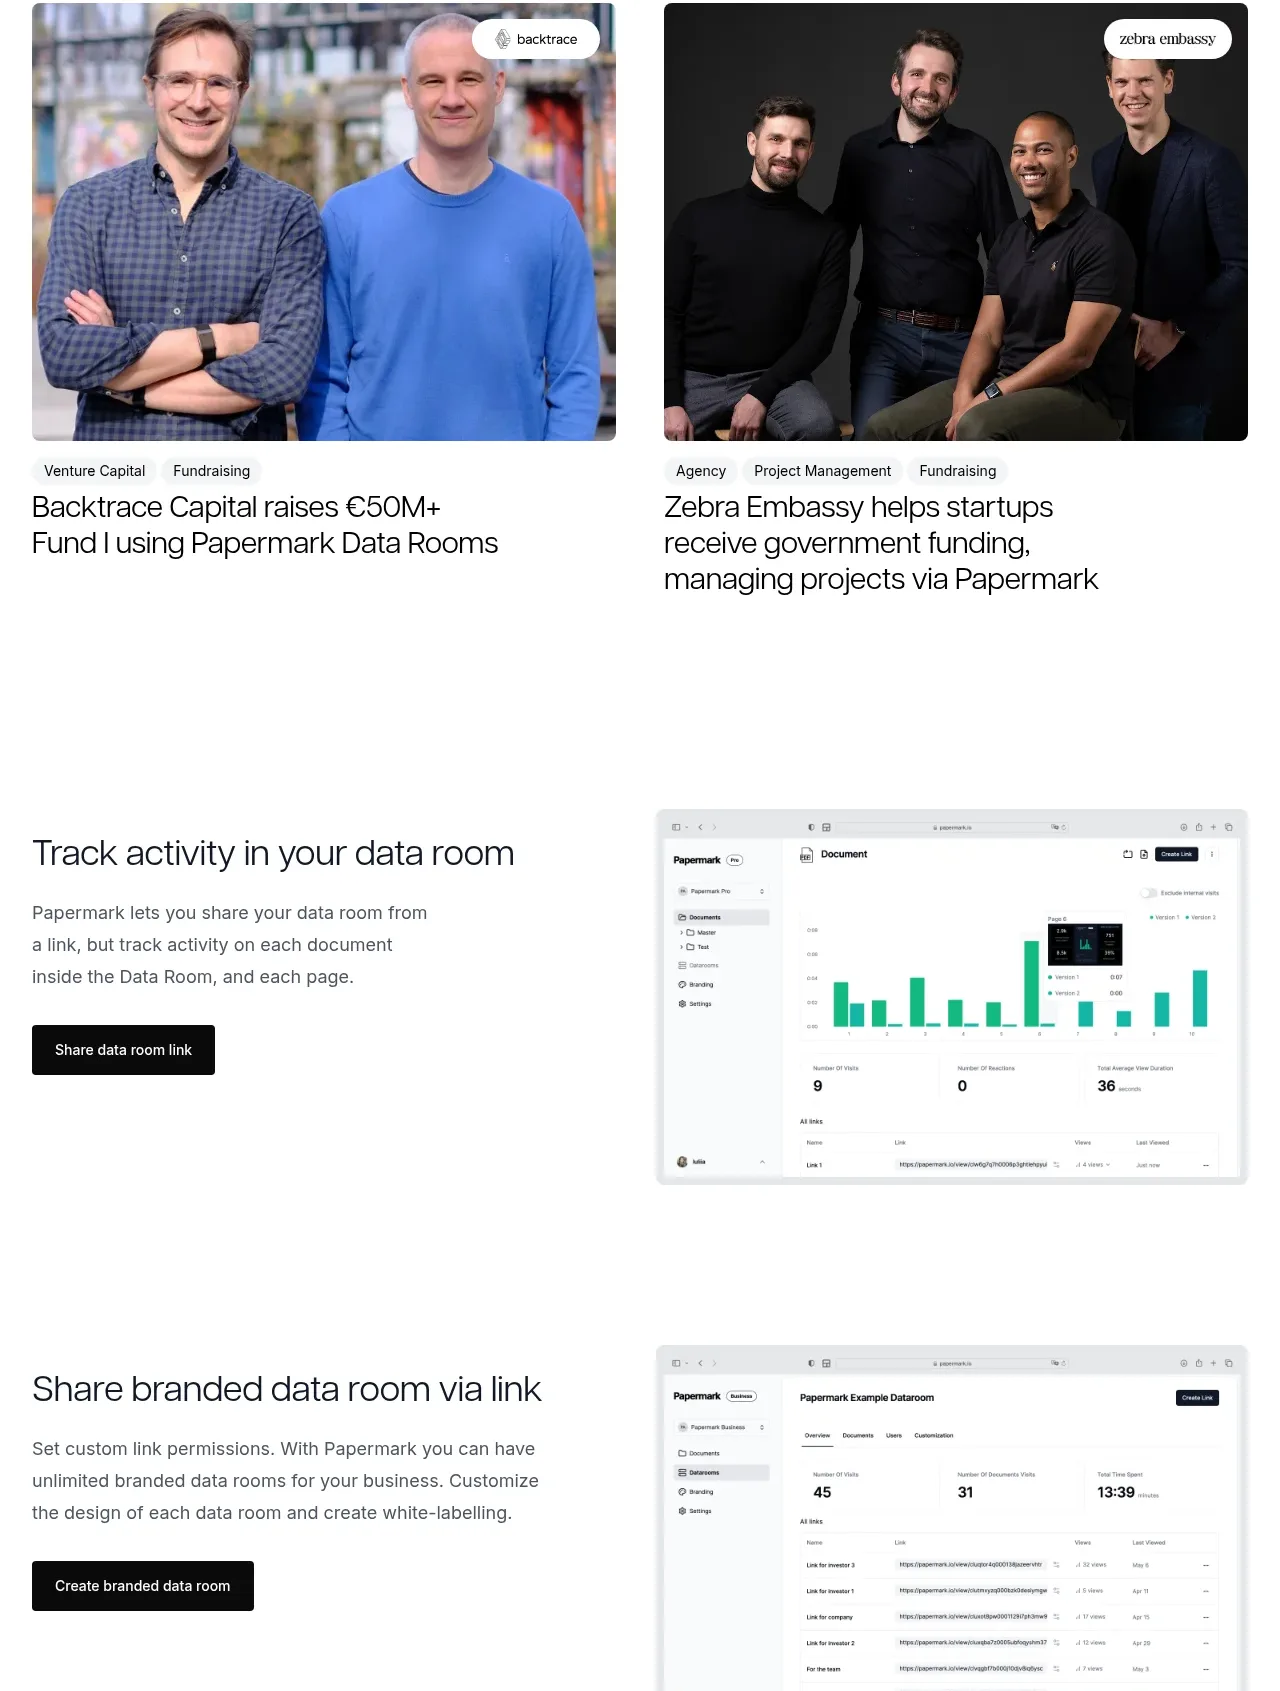
 Customer success stories
Papermark Data Rooms · Testimonials
Customer success stories
Papermark Data Rooms · Testimonials
 Employee and community testimonials
Papermark Data Rooms · Testimonials
Employee and community testimonials
Papermark Data Rooms · Testimonials

 Customer quote
Clips by Plastic · Testimonials
Customer quote
Clips by Plastic · Testimonials
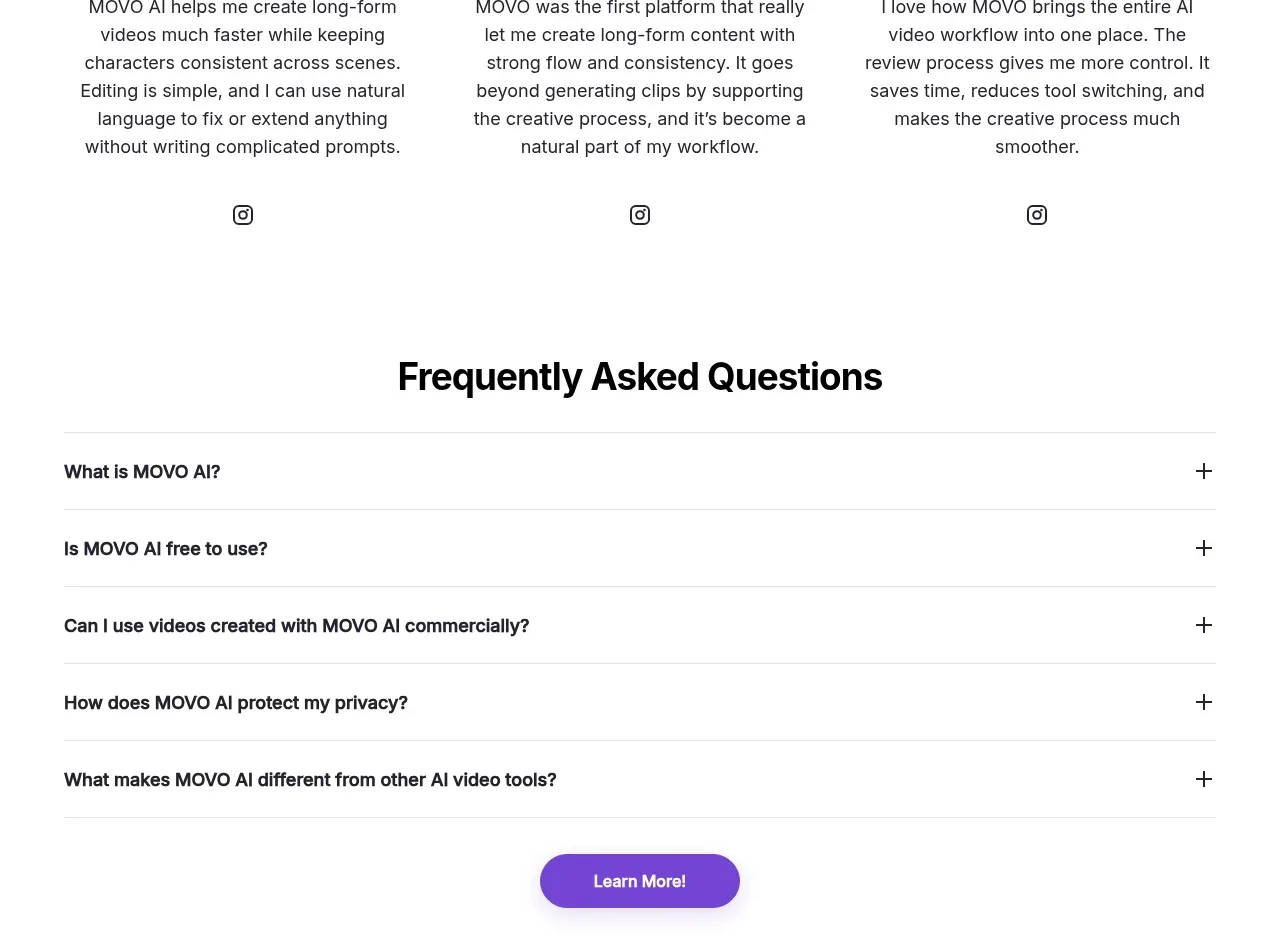
M
Creator testimonials
MOVO AI · Testimonials

 Founder and team testimonials
Fastlane 2.0 · Testimonials
Founder and team testimonials
Fastlane 2.0 · Testimonials
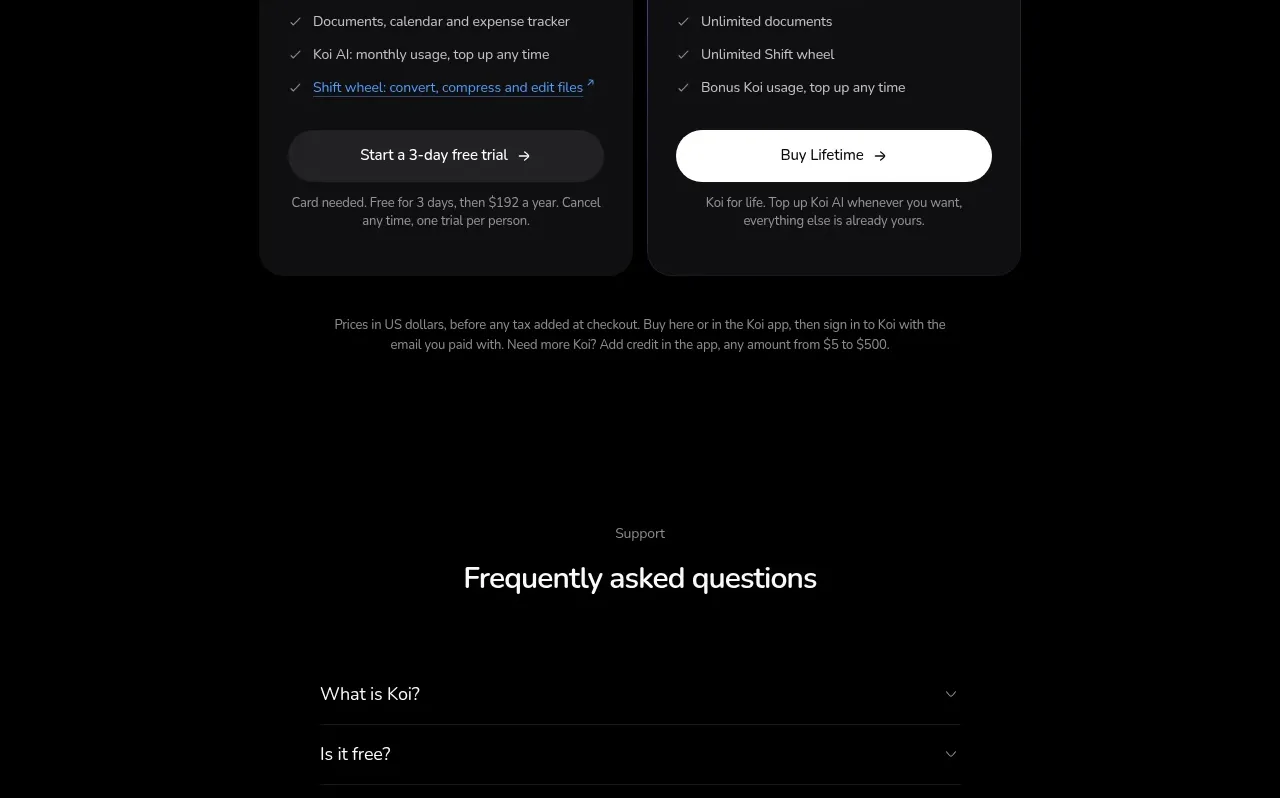
 Customer proof carousel
Koi · Testimonials
Customer proof carousel
Koi · Testimonials