 kage
plastic.audio
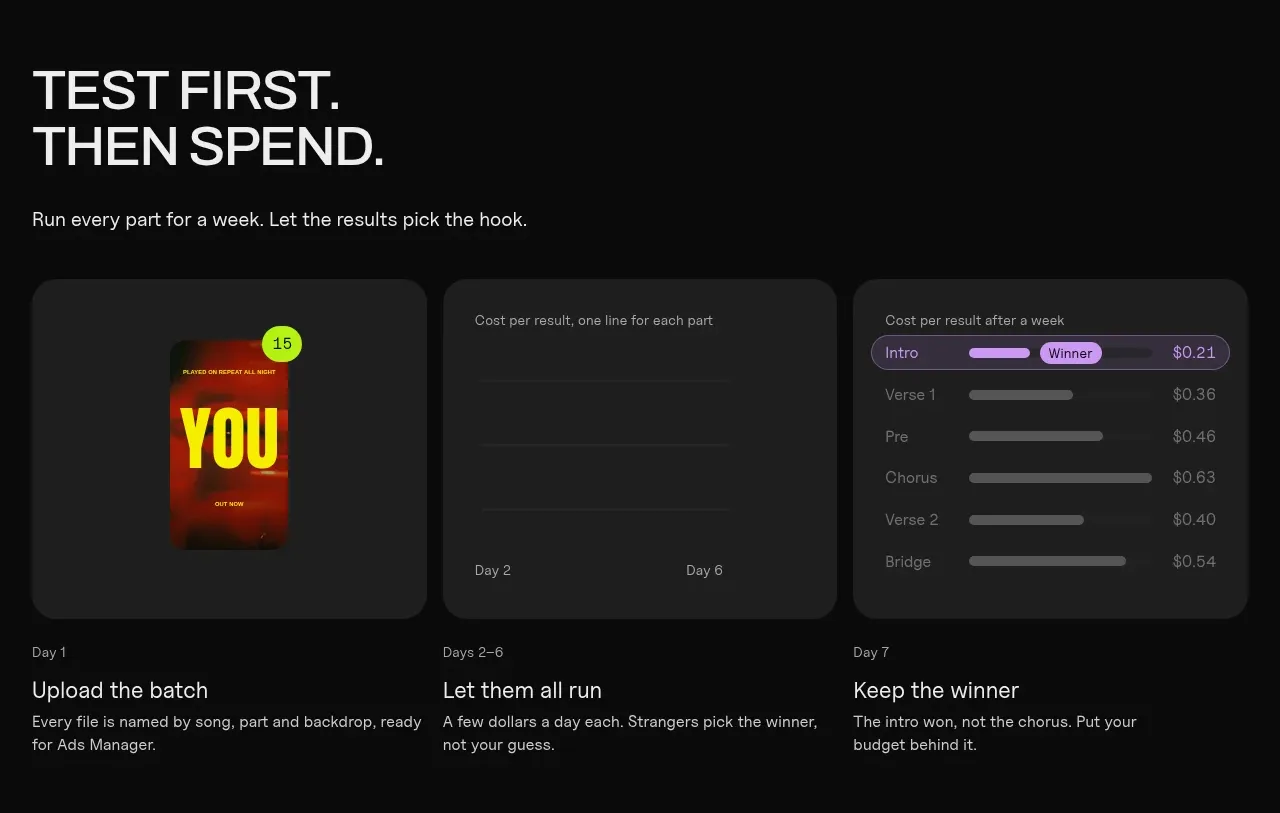
Design analysis
A three-part sequence explains testing, letting results accumulate, and choosing a winner using three adjacent dashboard-style panels.
Prompt preview
## Reference images

Study these alongside the description below: hierarchy, rhythm, spacing, colour. Build for the product you are asked about, using this design language.

- Component: https://kage-design-assets.t3.tigrisfiles.io/components/clips-by-plastic/ad43fef6-0048-4f88-83ea-4278fc30c273-1792994535-6.webp
- Full page it was cut from: https://kage-design-assets.t3.tigrisfiles.io/screenshots/clips-by-plastic/ad43fef6-0048-4f88-83ea-4278fc30c273-1792994476004-full.webp
- Component on Kage: https://kage.design/component/clips-by-plastic-feature-grid-4

## Before you start
Ask what experiment or decision loop the user's product supports and which metrics matter, then apply these principles.

Build a three-column testing section with a strong editorial heading and supporting sentence above. Under it, show three equal dark dashboard cards with simple visualizations: a sample output, a time/progress view, and a ranked comparison. Put a short label and concise explanation below each card. Use charcoal #202020 surfaces, 12–16px radii, fine #303030 borders, low-contrast chart scaffolding, and one bright accent for the winning state. Preserve an obvious left-to-right narrative and stack cards vertically on narrow screens.

Never: use logos, product names, copy, illustrations, or imagery from the reference.
More components
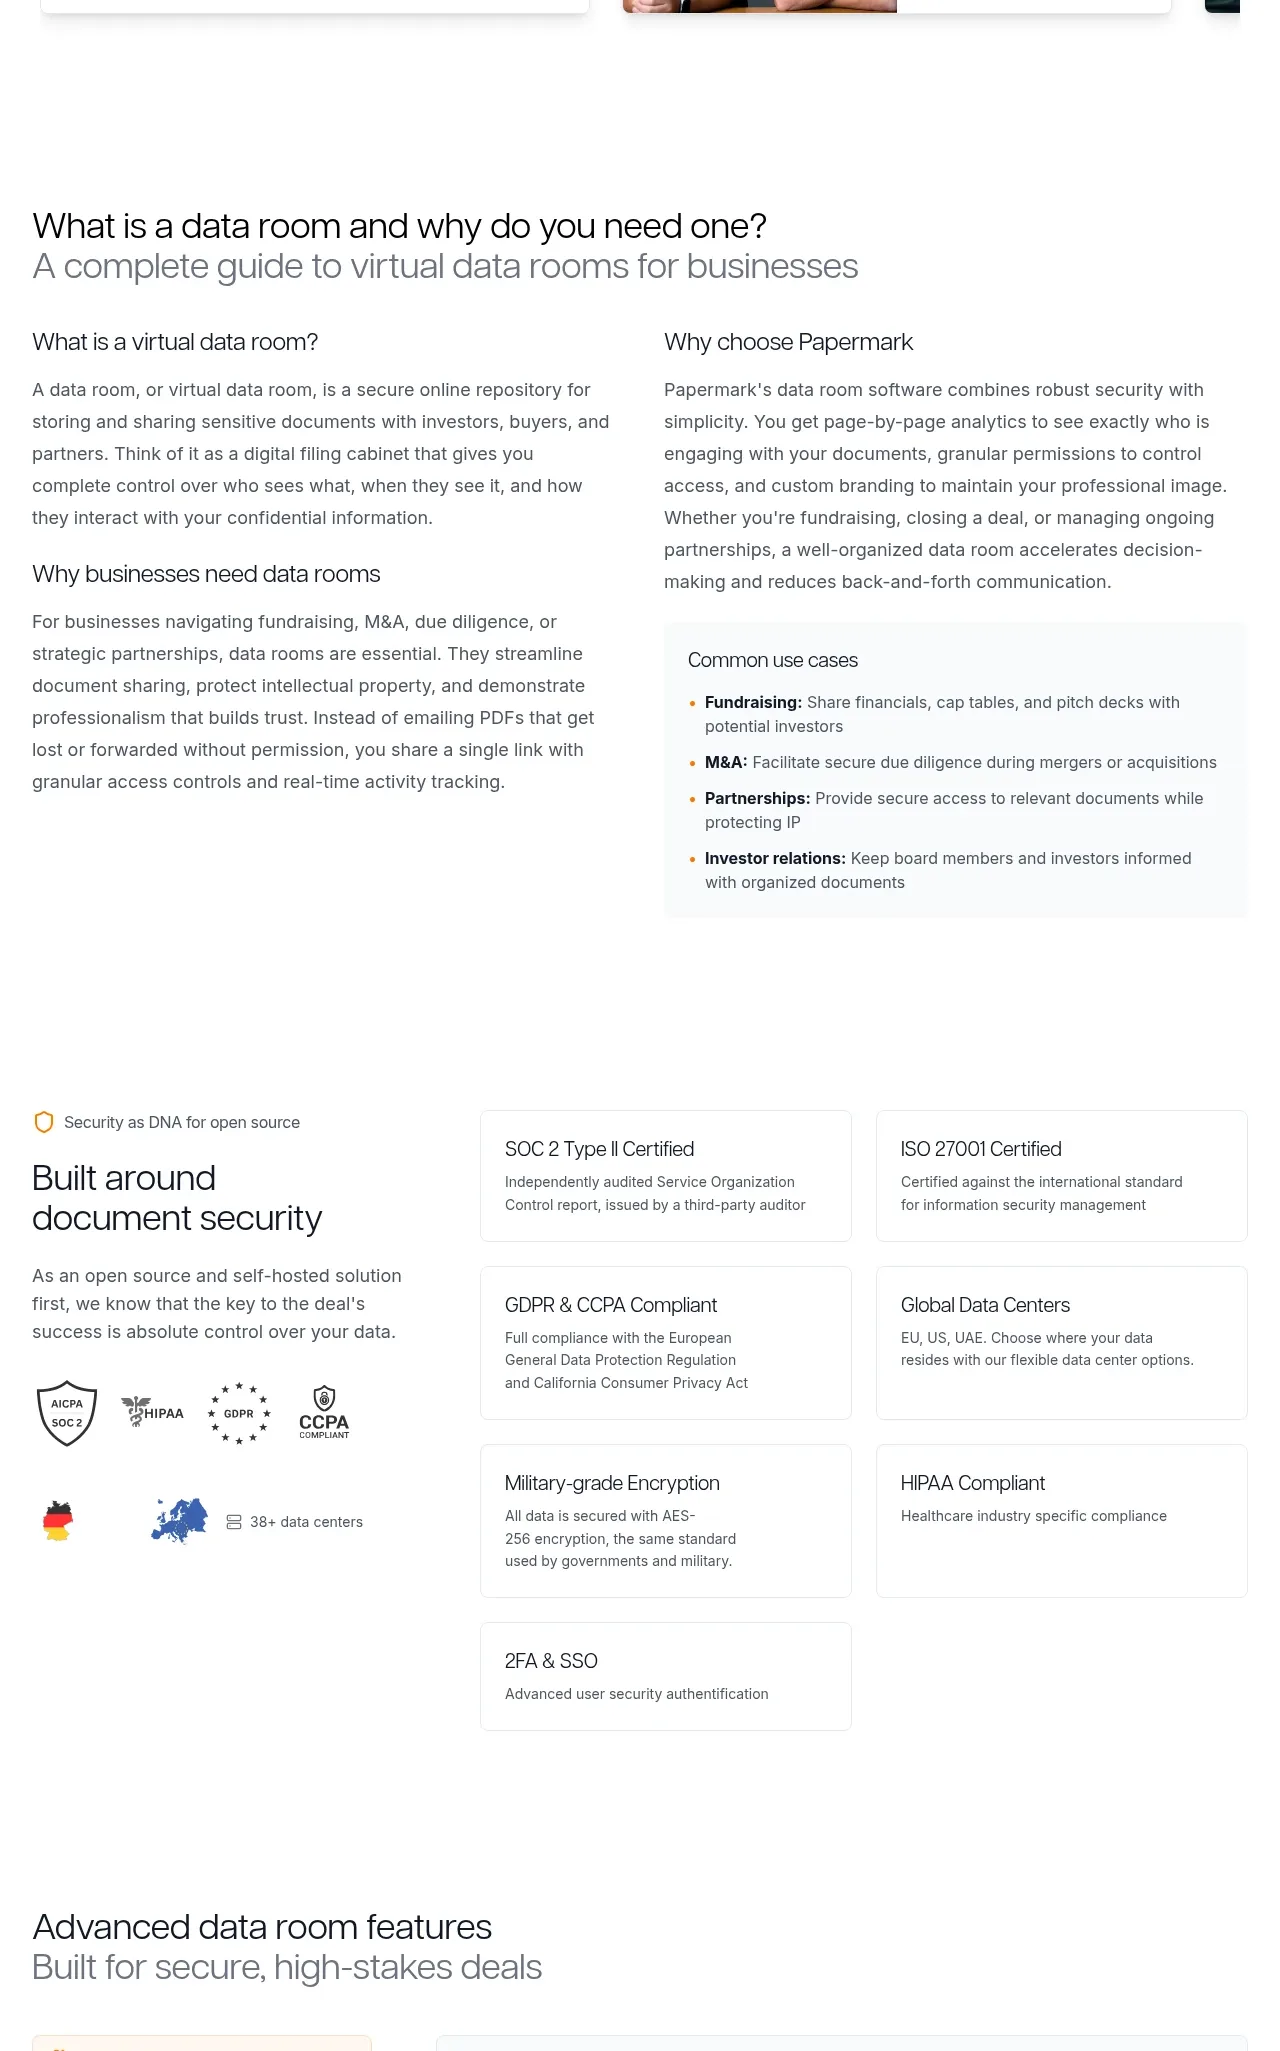
 Data-room education and security overview
Papermark Data Rooms · Feature grid
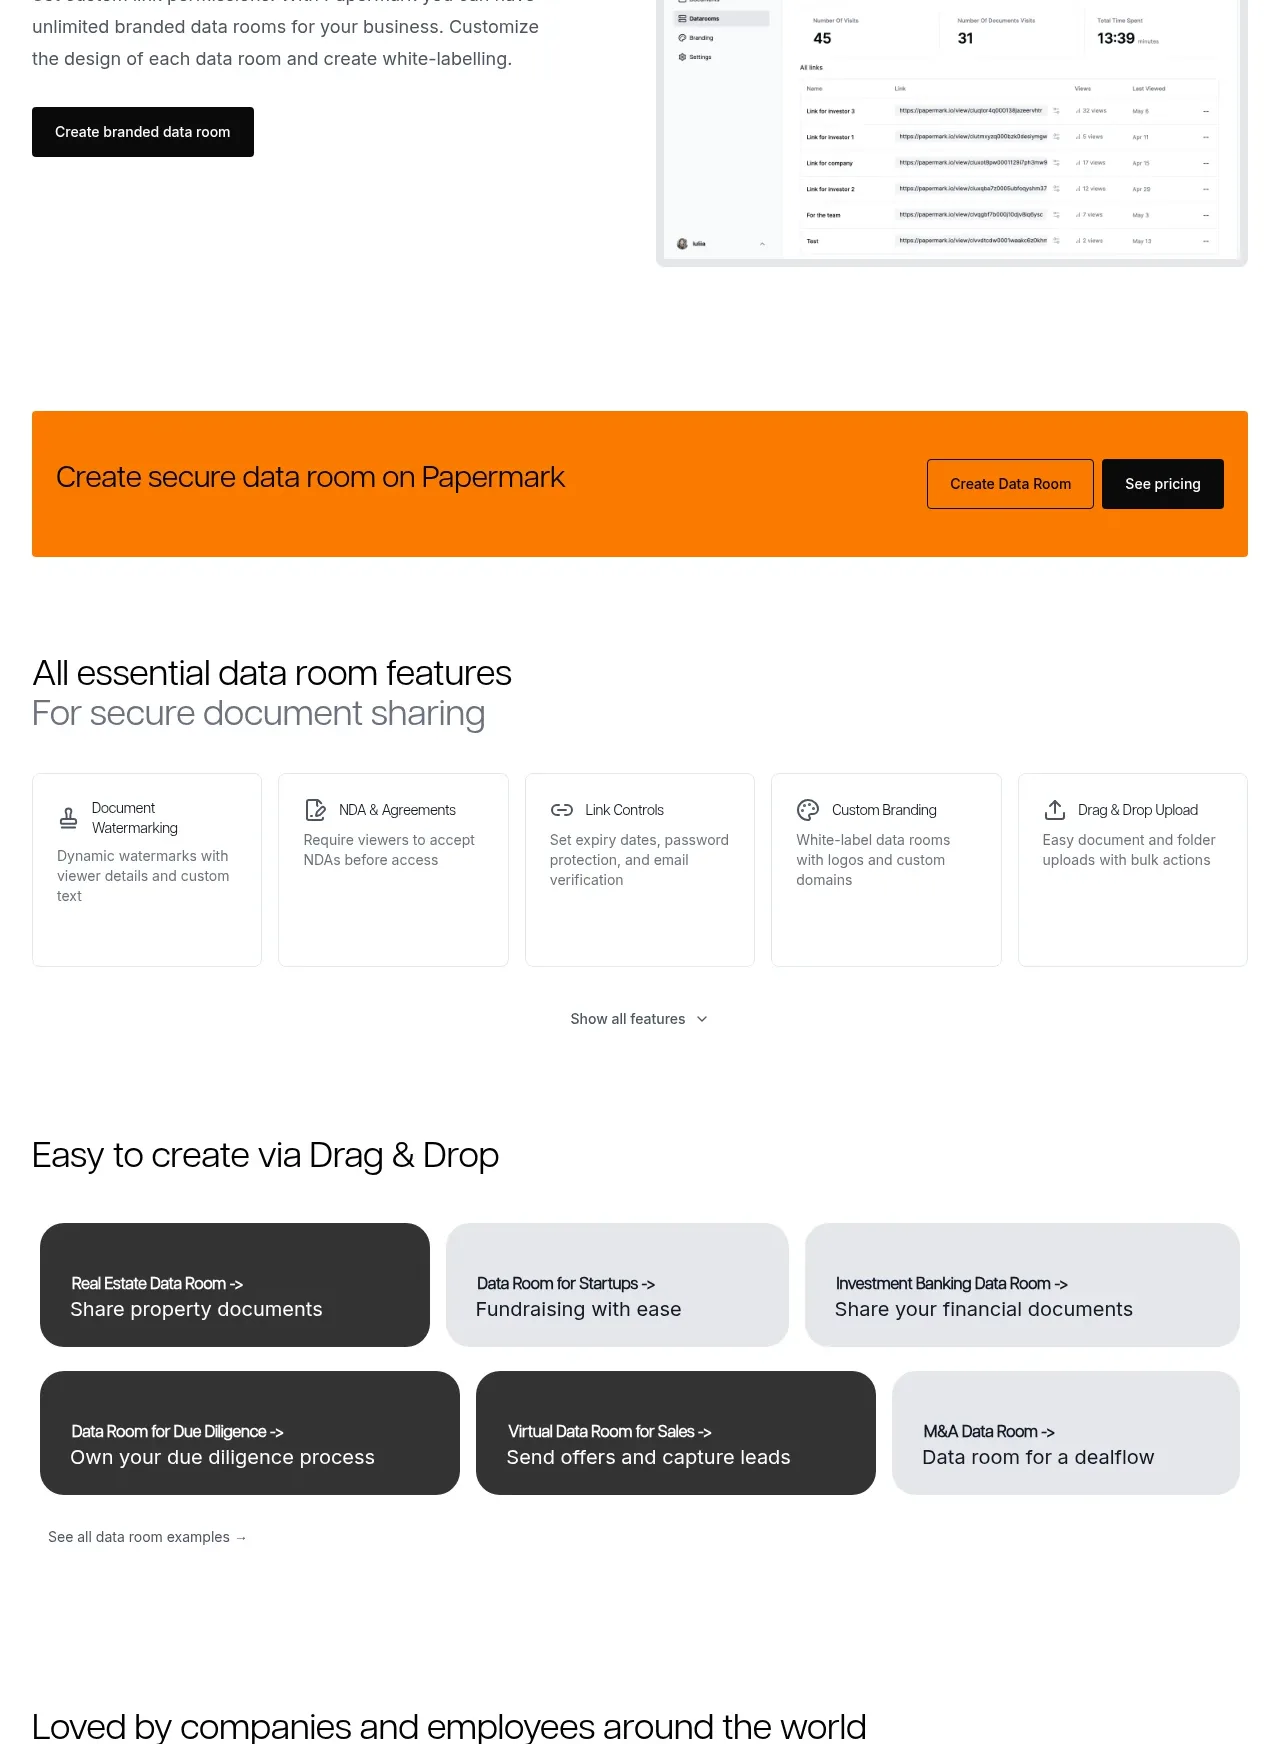 Workflow demonstrations
Papermark Data Rooms · Feature grid
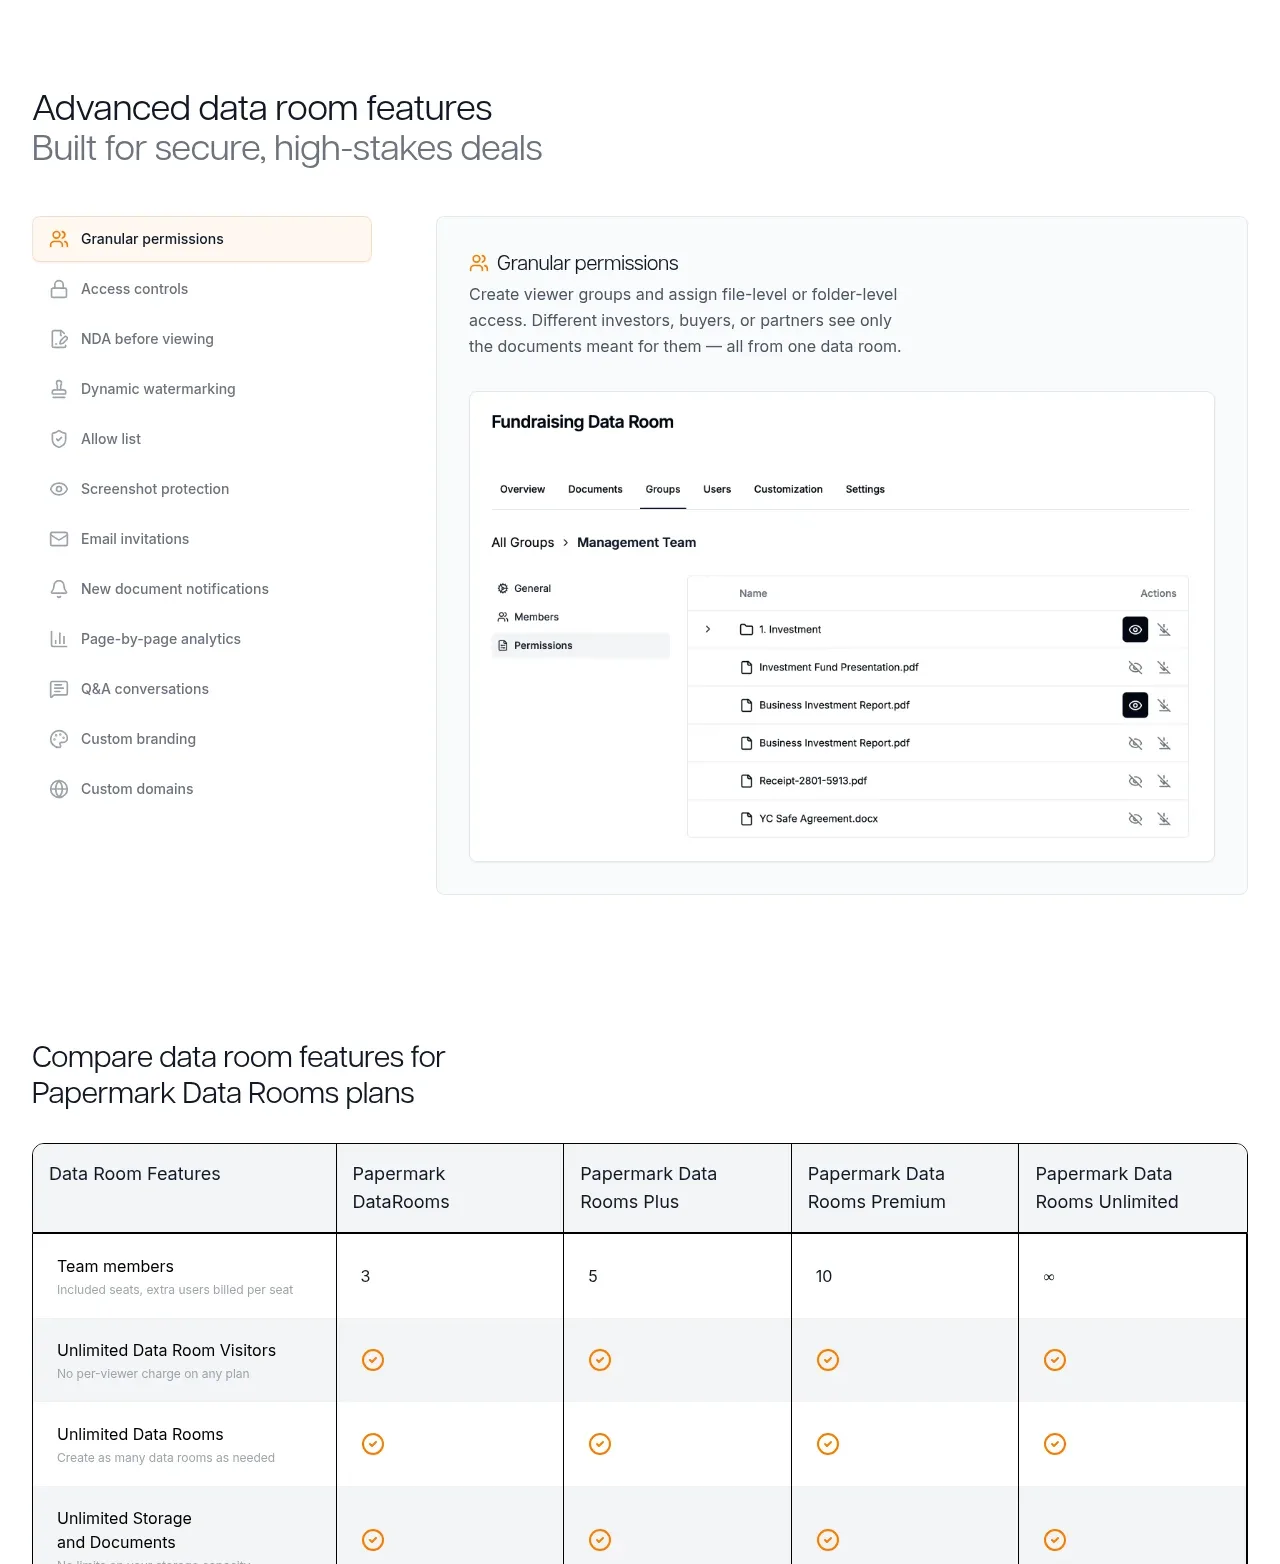 Advanced data-room features
Papermark Data Rooms · Feature grid
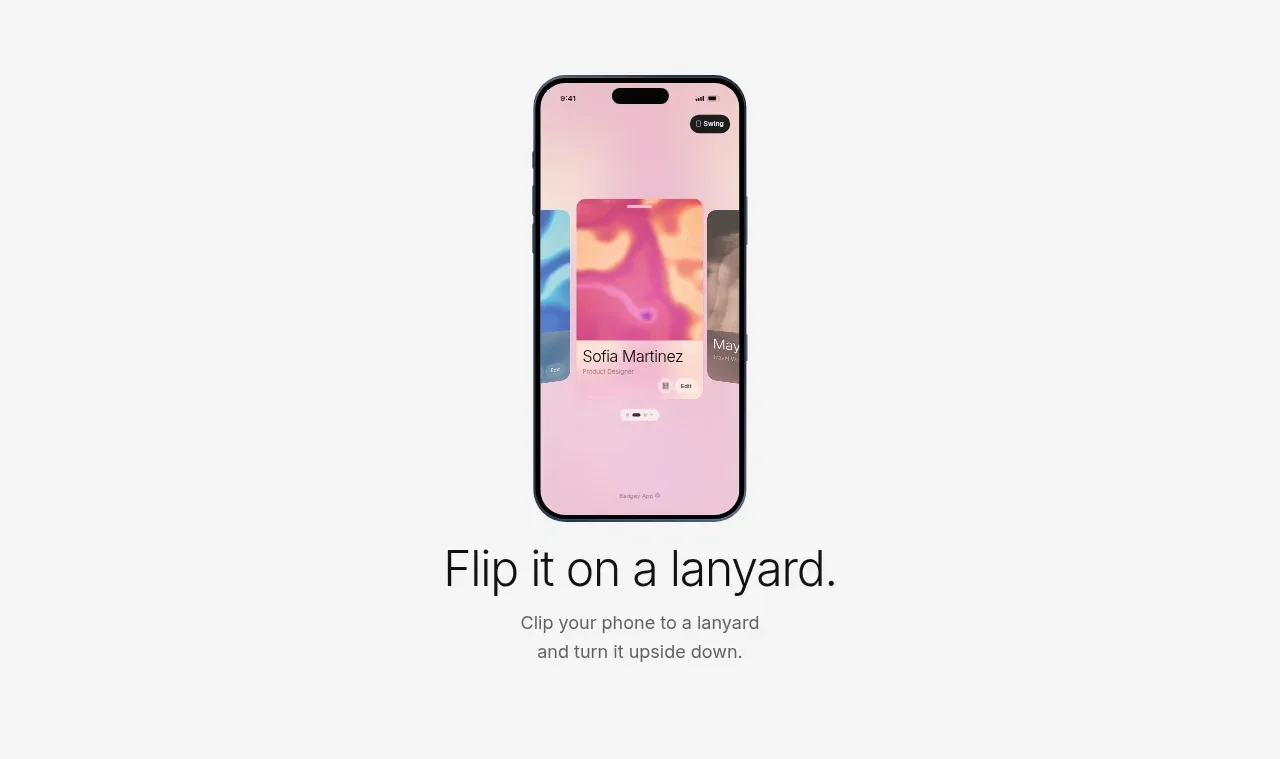
 Lanyard use-case feature
Badgey · Feature grid

 Problem statement
Clips by Plastic · Feature grid
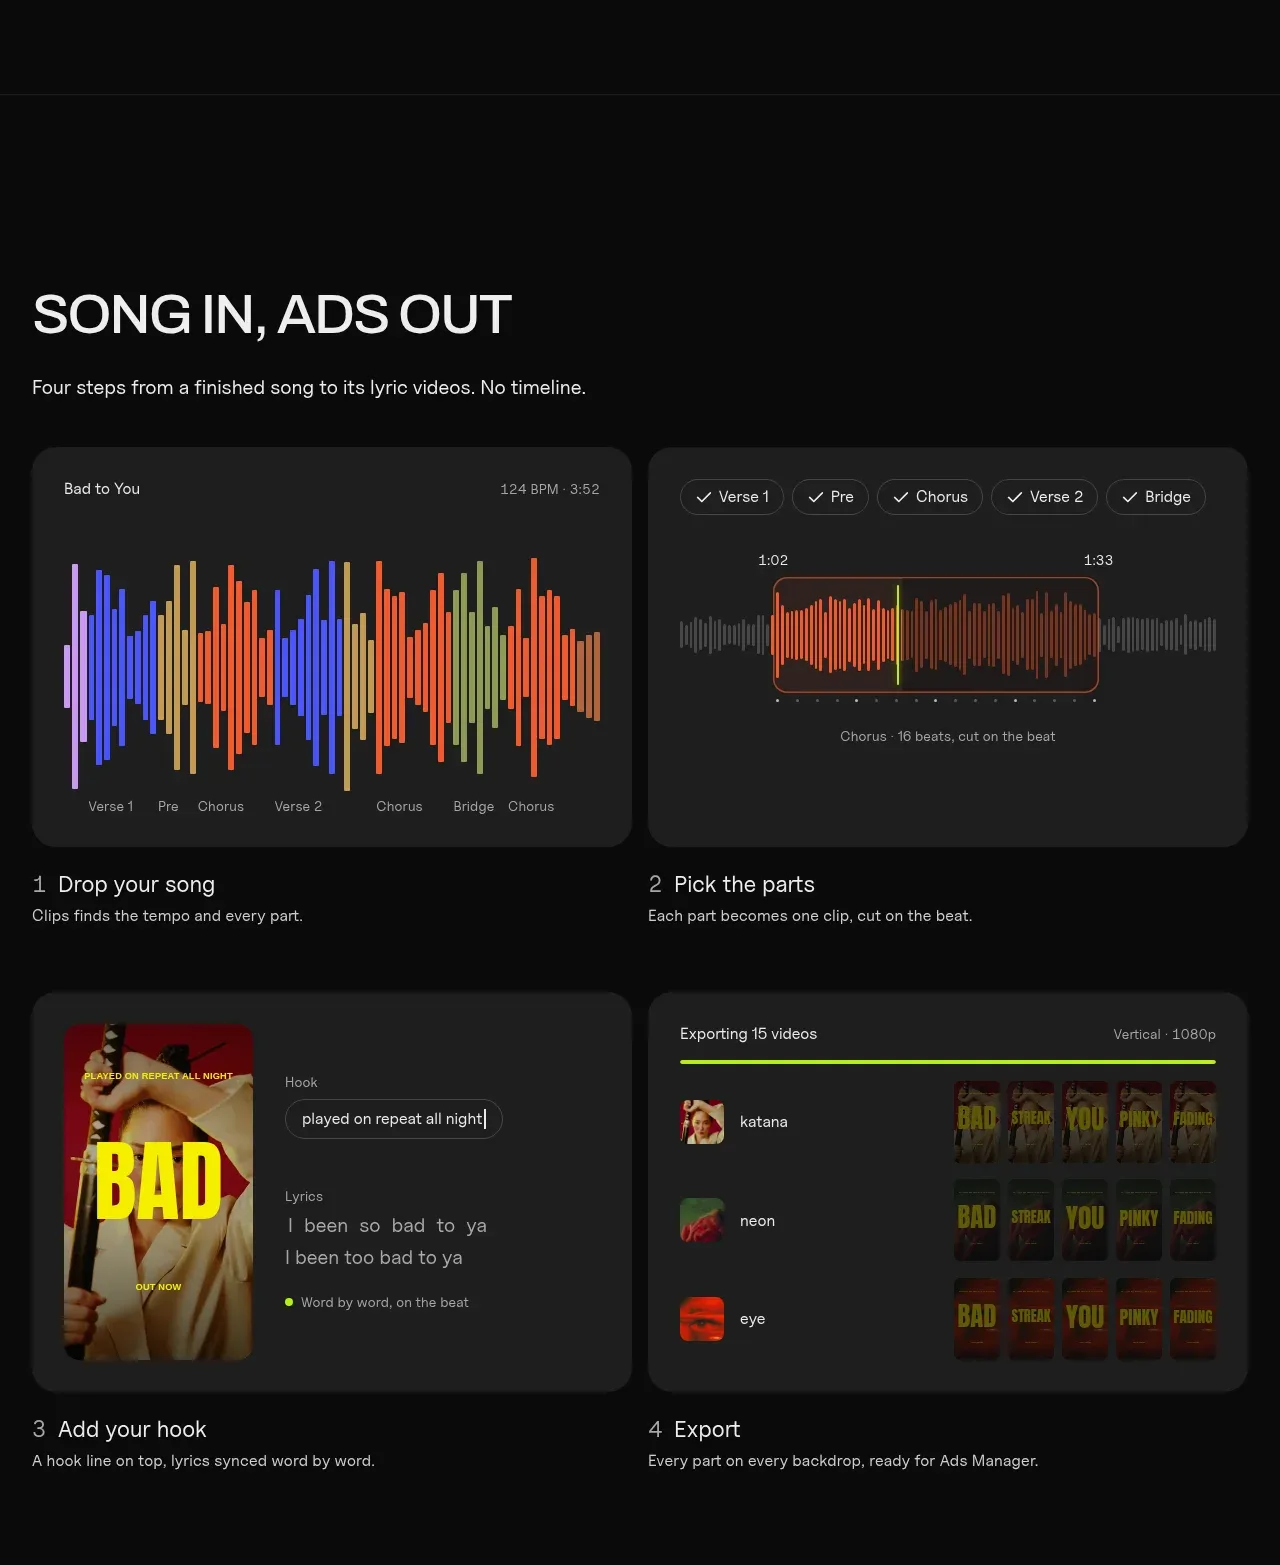 Four-step workflow
Clips by Plastic · Feature grid