 kage
kage
alkera.ai

Design analysis
This feature band combines a two-column heading and explanatory paragraph with a wide split interface showing notebook code beside a dashboard, making the workflow immediately understandable.
Prompt preview
## Reference images

Study these alongside the description below: hierarchy, rhythm, spacing, colour. Build for the product you are asked about, using this design language.

- Component: https://kage-design-assets.t3.tigrisfiles.io/components/databench-by-alkera/229e473d-7918-4538-a962-0aa359369c12-1791439389-4.webp
- Full page it was cut from: https://kage-design-assets.t3.tigrisfiles.io/screenshots/databench-by-alkera/229e473d-7918-4538-a962-0aa359369c12-1791439317723-full.webp
- Component on Kage: https://kage.design/component/databench-by-alkera-feature-grid-2

## Before you start
Ask the user what workflow they want to showcase, which artifacts users create, and what brand and UI system should be used. Build an original version for that product.

Build a feature band on a cool pale-gray surface (#e8eef3) with a two-column introductory row: a large 36–42px headline on the left and a 16–18px explanatory paragraph on the right. Under it, show one wide rounded application mockup that visibly combines two related workspaces, such as an editor and a report/dashboard. Use a clean split composition, realistic but original interface details, thin neutral borders, 12–16px radius, and a subtle shadow. Add a dark rounded “learn more” button aligned below or to the right of the preview. Keep the visual legible at desktop width and stack the text and preview on mobile.

Never: use logos, product names, copy, illustrations, or imagery from the reference.
More components
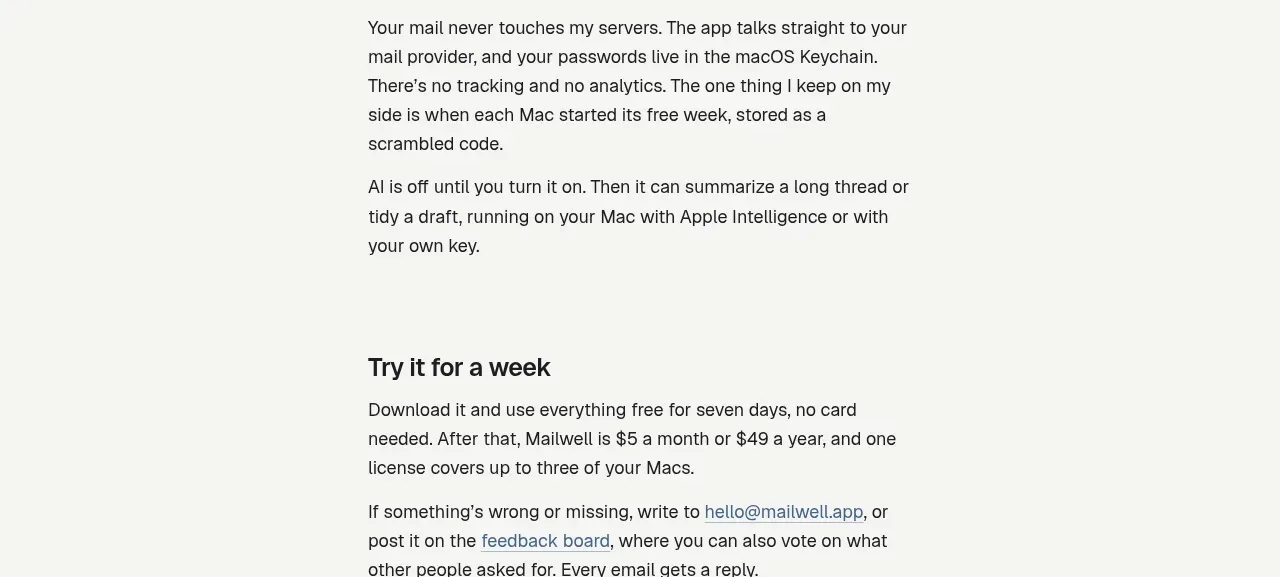
 Privacy and optional intelligence
Mailwell · Feature grid
Privacy and optional intelligence
Mailwell · Feature grid
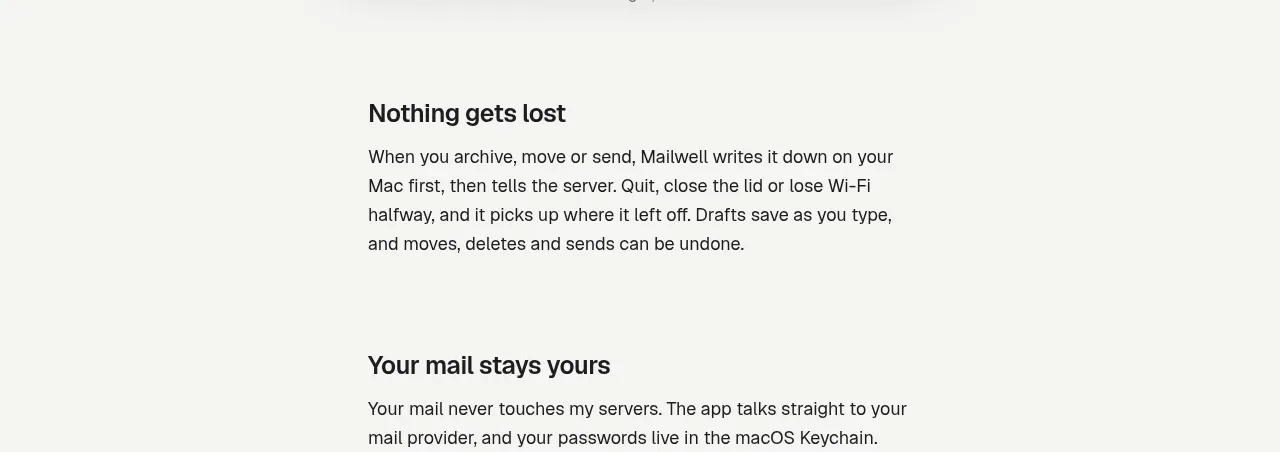 Reliable, recoverable actions
Mailwell · Feature grid
Reliable, recoverable actions
Mailwell · Feature grid
 Unified account setup
Mailwell · Feature grid
Unified account setup
Mailwell · Feature grid
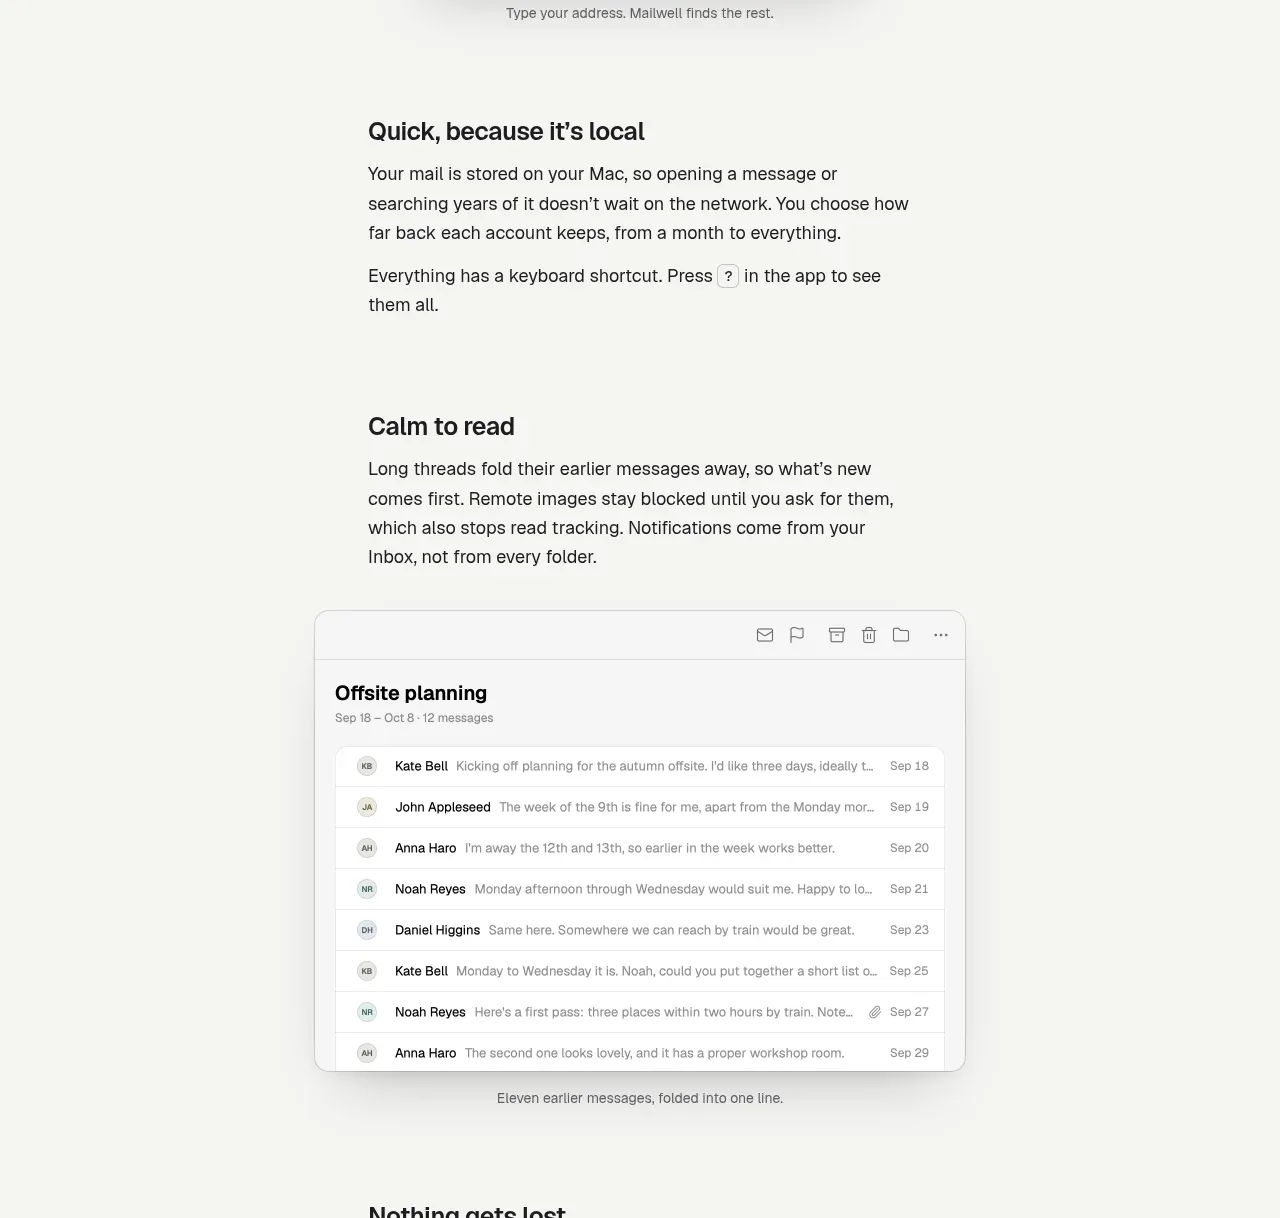 Fast local workflow and calm reading
Mailwell · Feature grid
Fast local workflow and calm reading
Mailwell · Feature grid
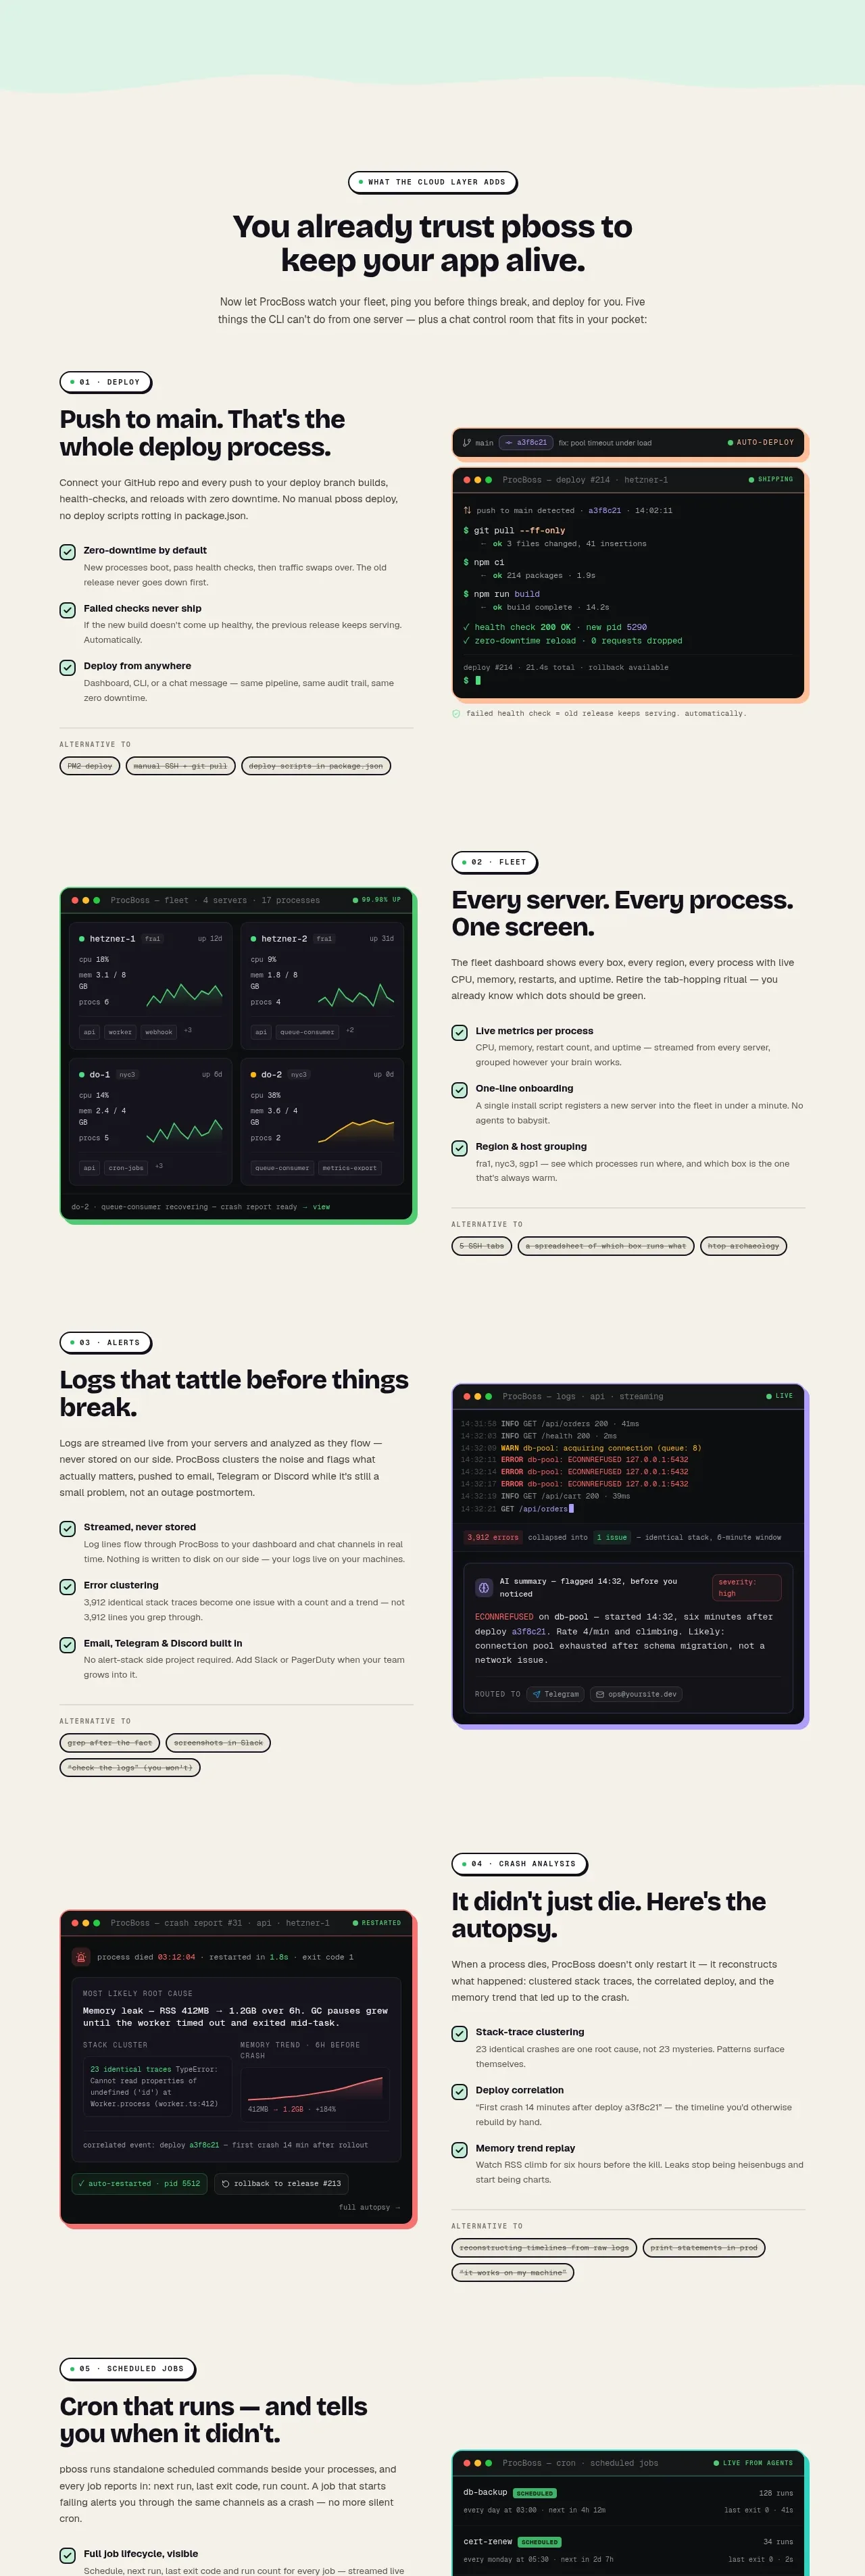
 Cloud layer workflows
ProcBoss · Feature grid
Cloud layer workflows
ProcBoss · Feature grid
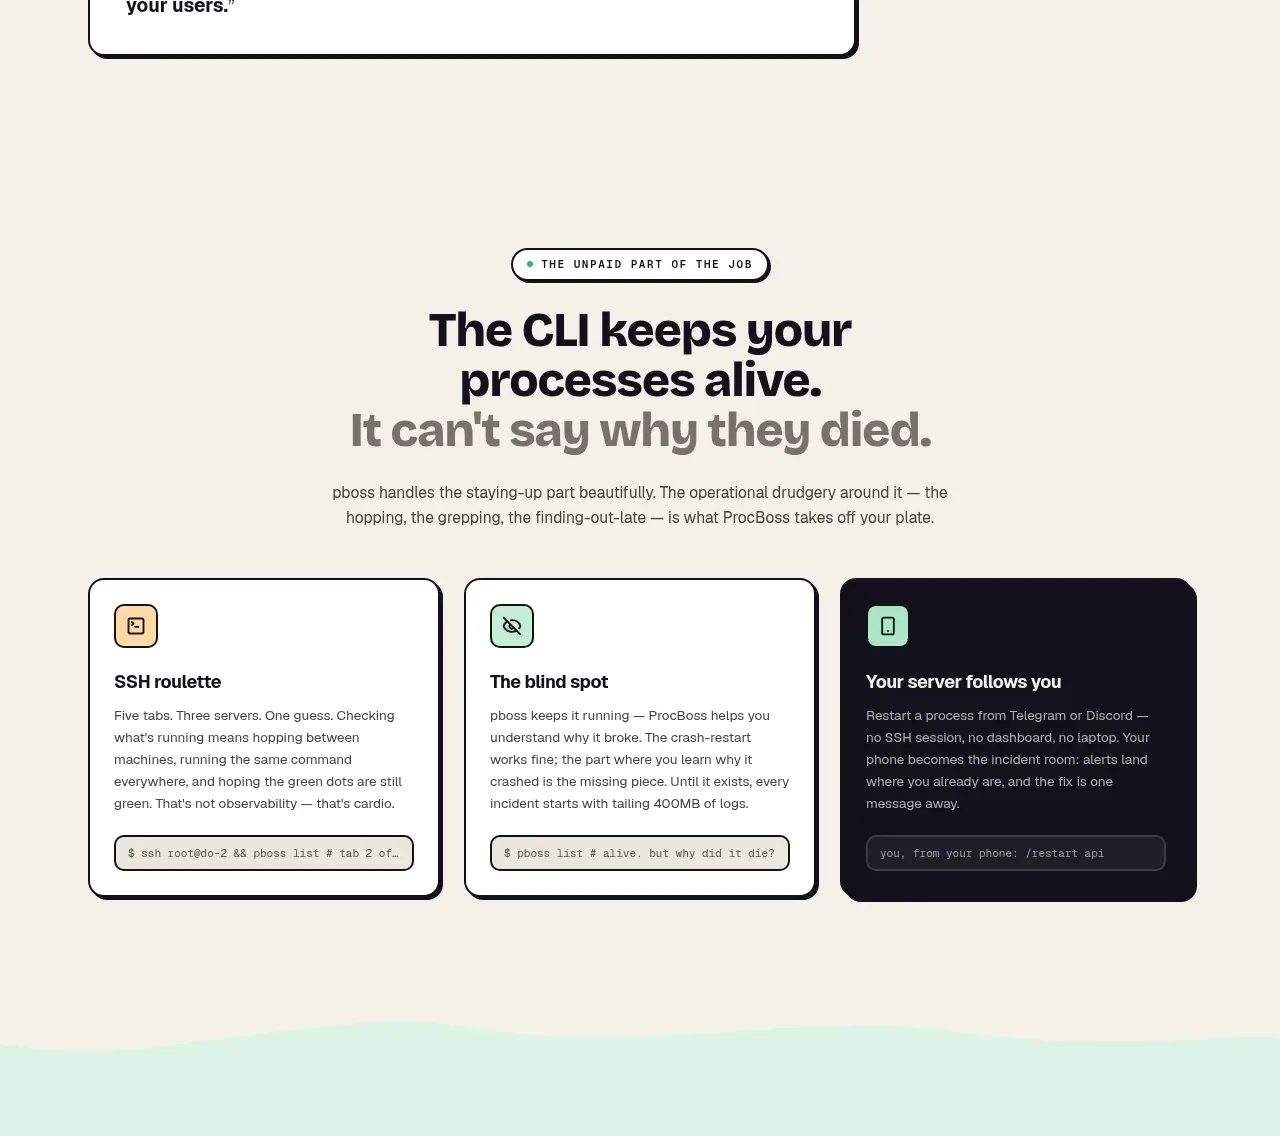 Operational blind spots
ProcBoss · Feature grid
Operational blind spots
ProcBoss · Feature grid