 kage
throxy.com
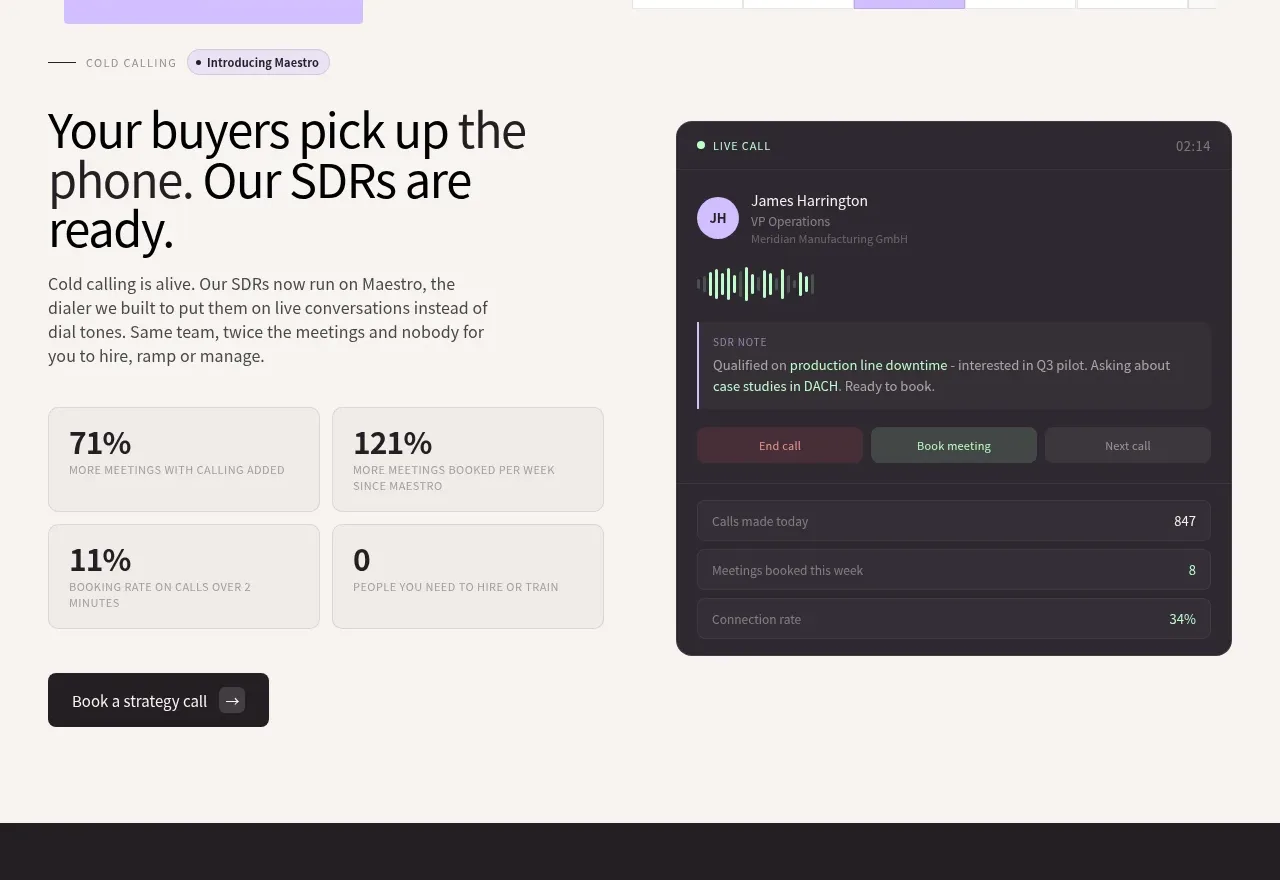
Design analysis
A light split section explains the service beside a dark live-call dashboard, with four compact proof metrics and a secondary CTA.
Prompt preview
## Reference images

Study these alongside the description below: hierarchy, rhythm, spacing, colour. Build for the product you are asked about, using this design language.

- Component: https://kage-design-assets.t3.tigrisfiles.io/components/throxy/4d577be3-3944-4c06-b2f6-094c0e693ab7-1793253968-2.webp
- Full page it was cut from: https://kage-design-assets.t3.tigrisfiles.io/screenshots/throxy/4d577be3-3944-4c06-b2f6-094c0e693ab7-1793253814515-full.webp
- Component on Kage: https://kage.design/component/throxy-feature-grid

### Before you start
Ask what the user's product, audience, and brand are, then apply these principles to that product.

Build a light-background feature section with a two-column layout. The left side contains an eyebrow, an assertive multi-line heading, short explanatory copy, a 2×2 grid of small metric cards, and a dark secondary button; the right side contains a rounded dark product dashboard showing live status, activity, notes, and controls. Use 48–64px heading typography, 14–16px body text, 16px card radii, 1px #DDD9D3 borders, and restrained lavender/mint accents against #242025. Keep metrics visually subordinate to the headline and make the dashboard feel like evidence rather than decoration. Include responsive stacking and meaningful labels.

Never: use logos, product names, copy, illustrations, or imagery from the reference.
More components
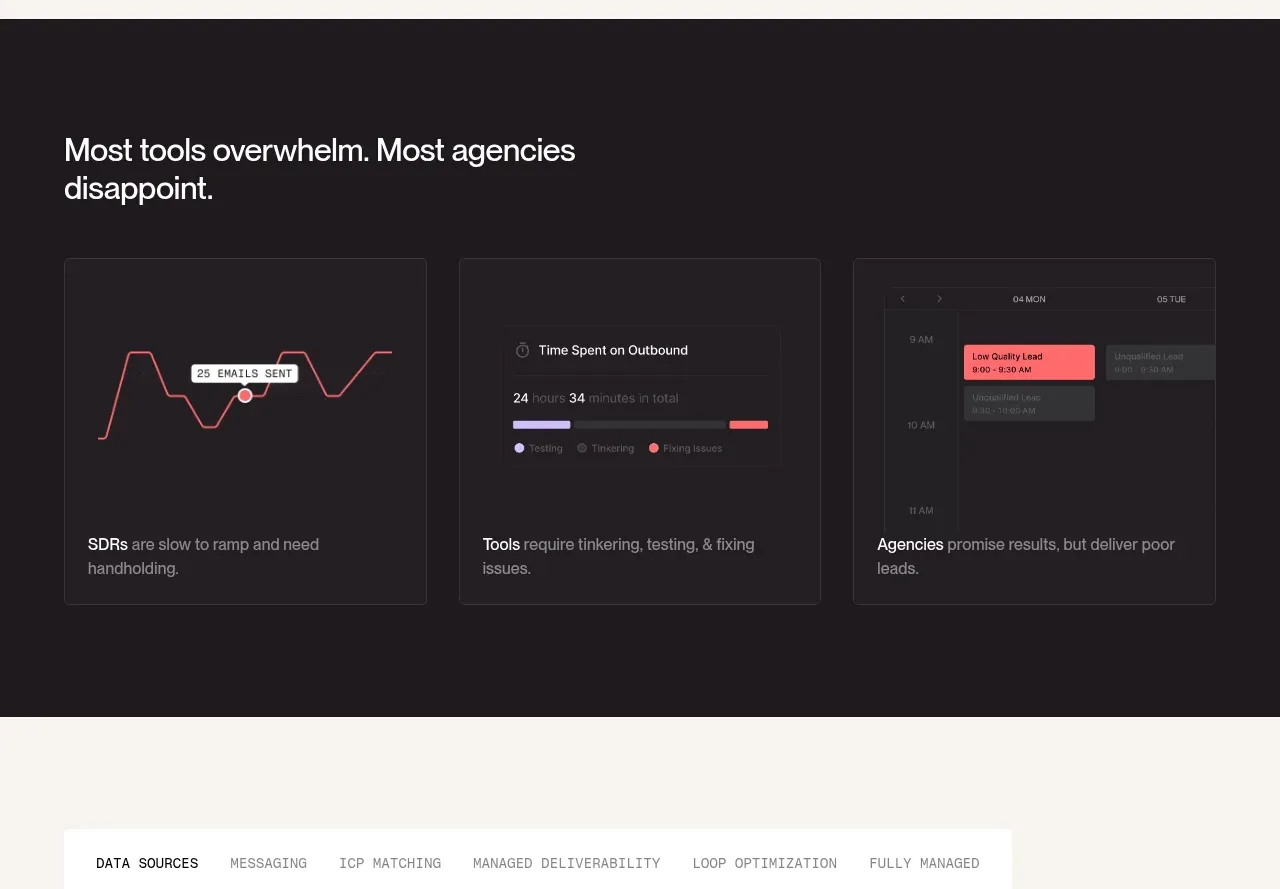
 Why alternatives disappoint
throxy · Feature grid
 Outbound partner benefits
throxy · Feature grid
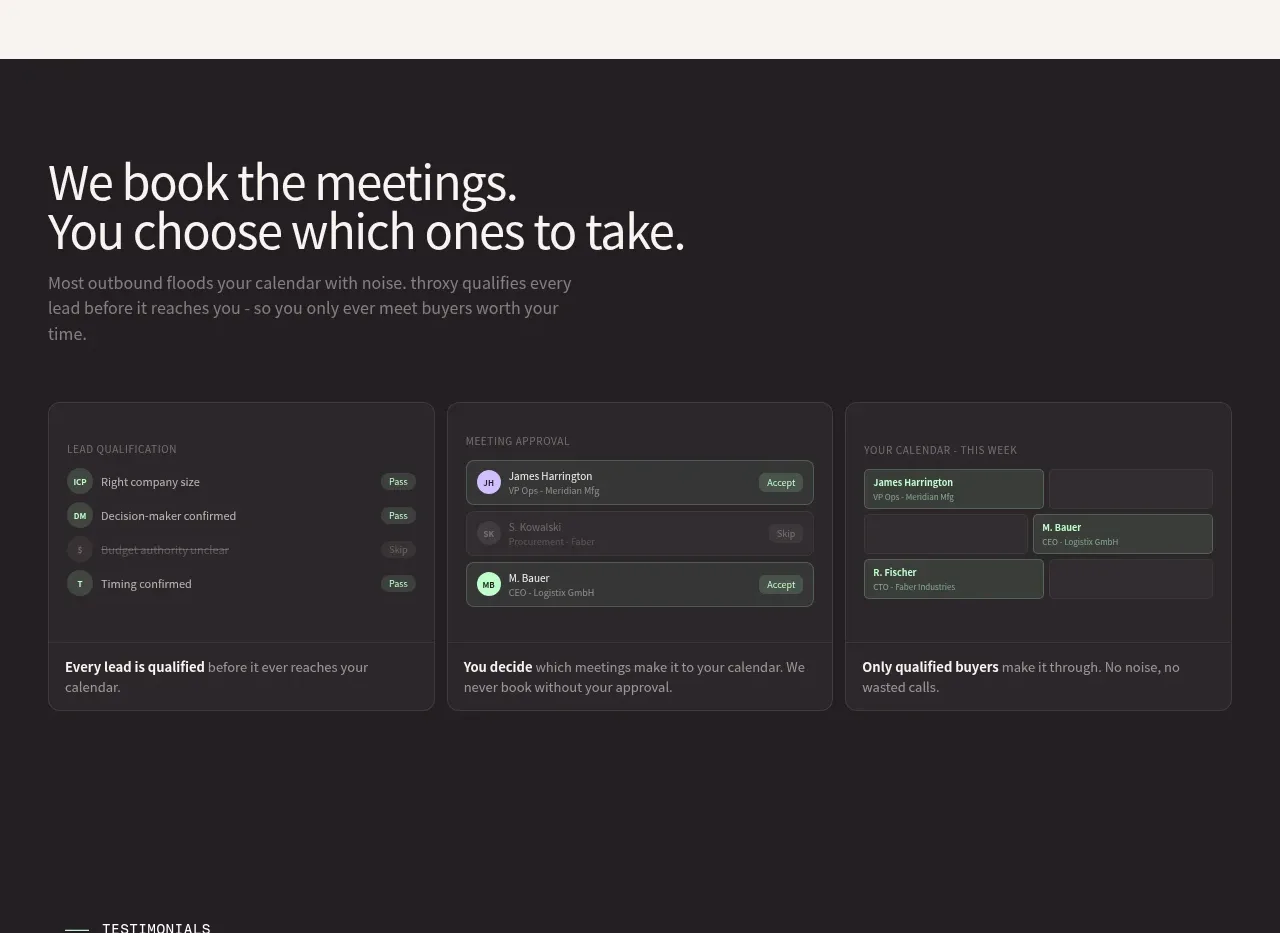 Qualification workflow cards
throxy · Feature grid
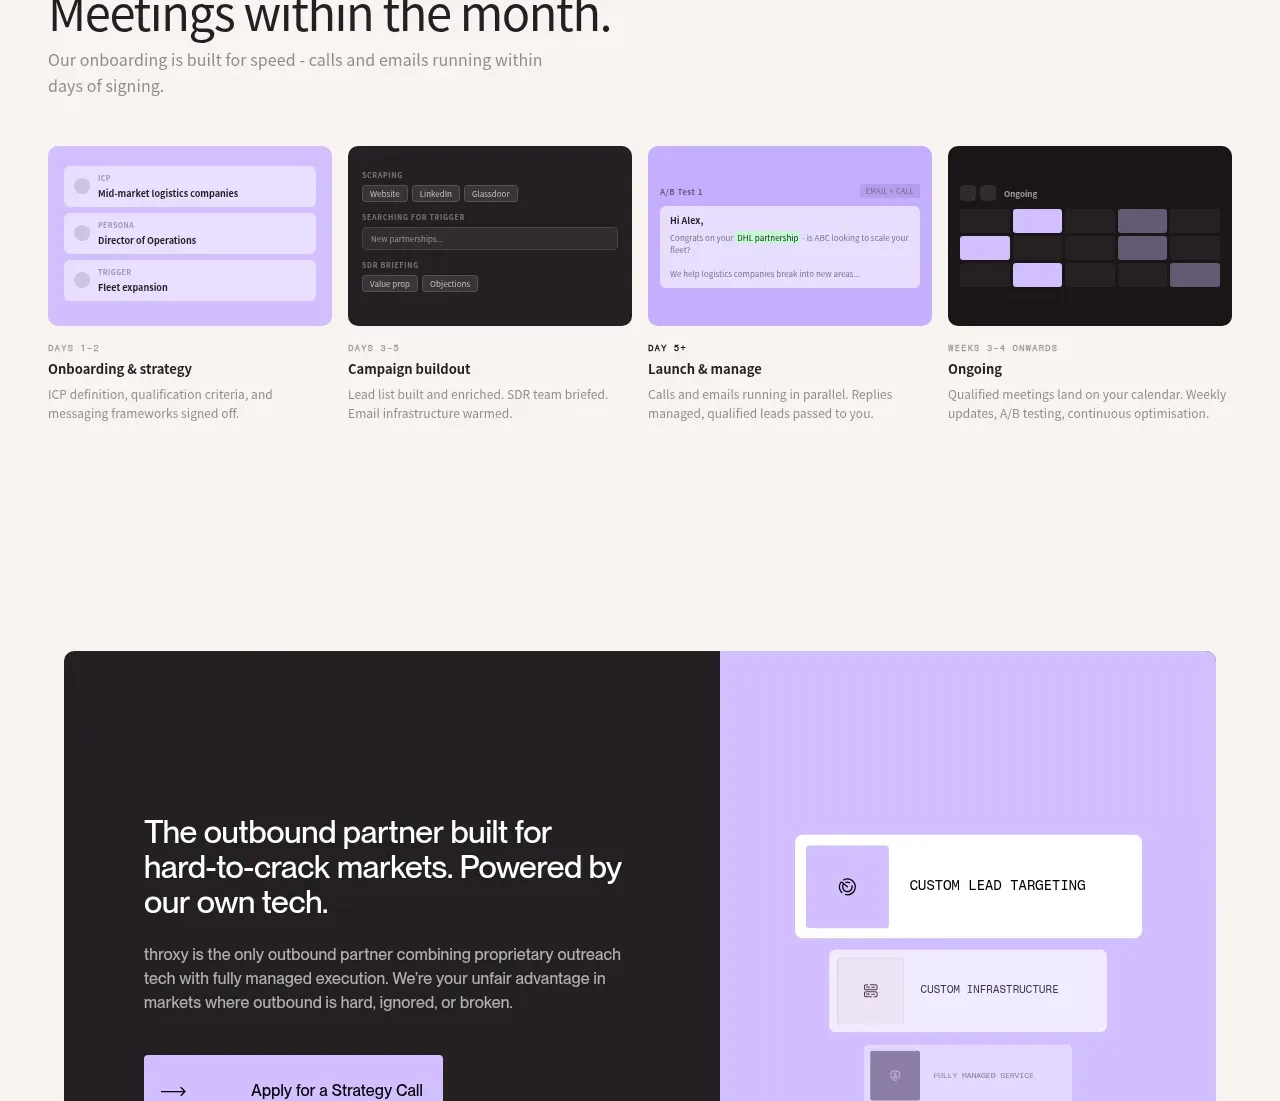 Rapid onboarding timeline
throxy · Feature grid
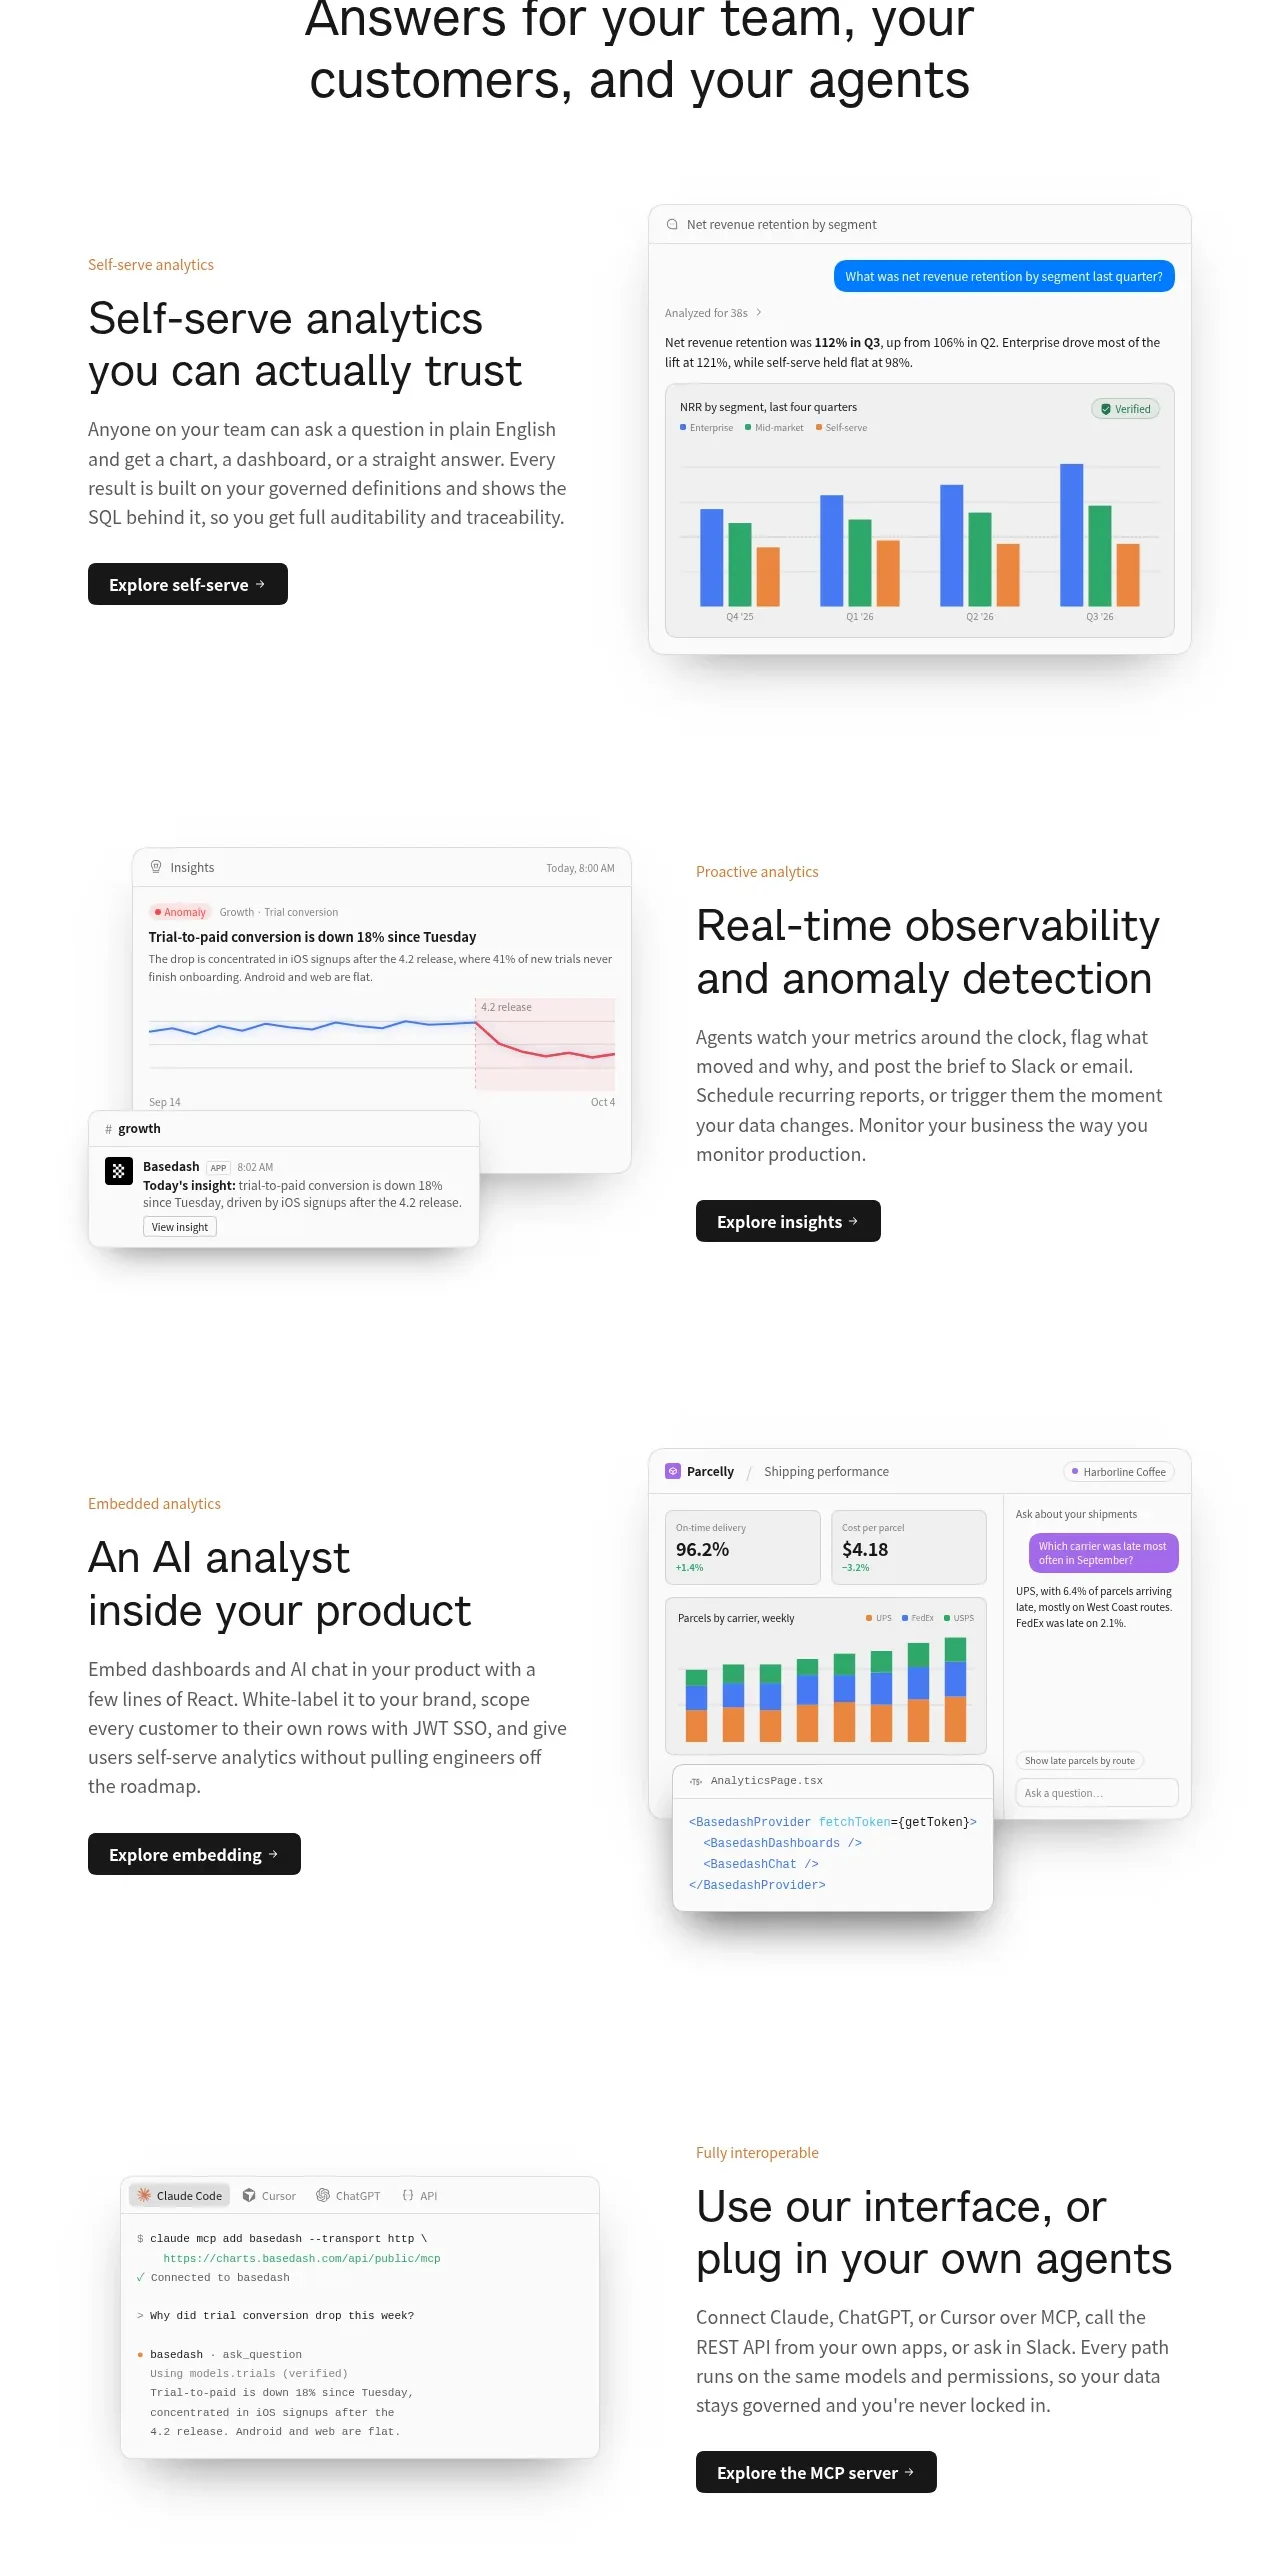
 Analytics capability showcase
Basedash View-only members · Feature grid
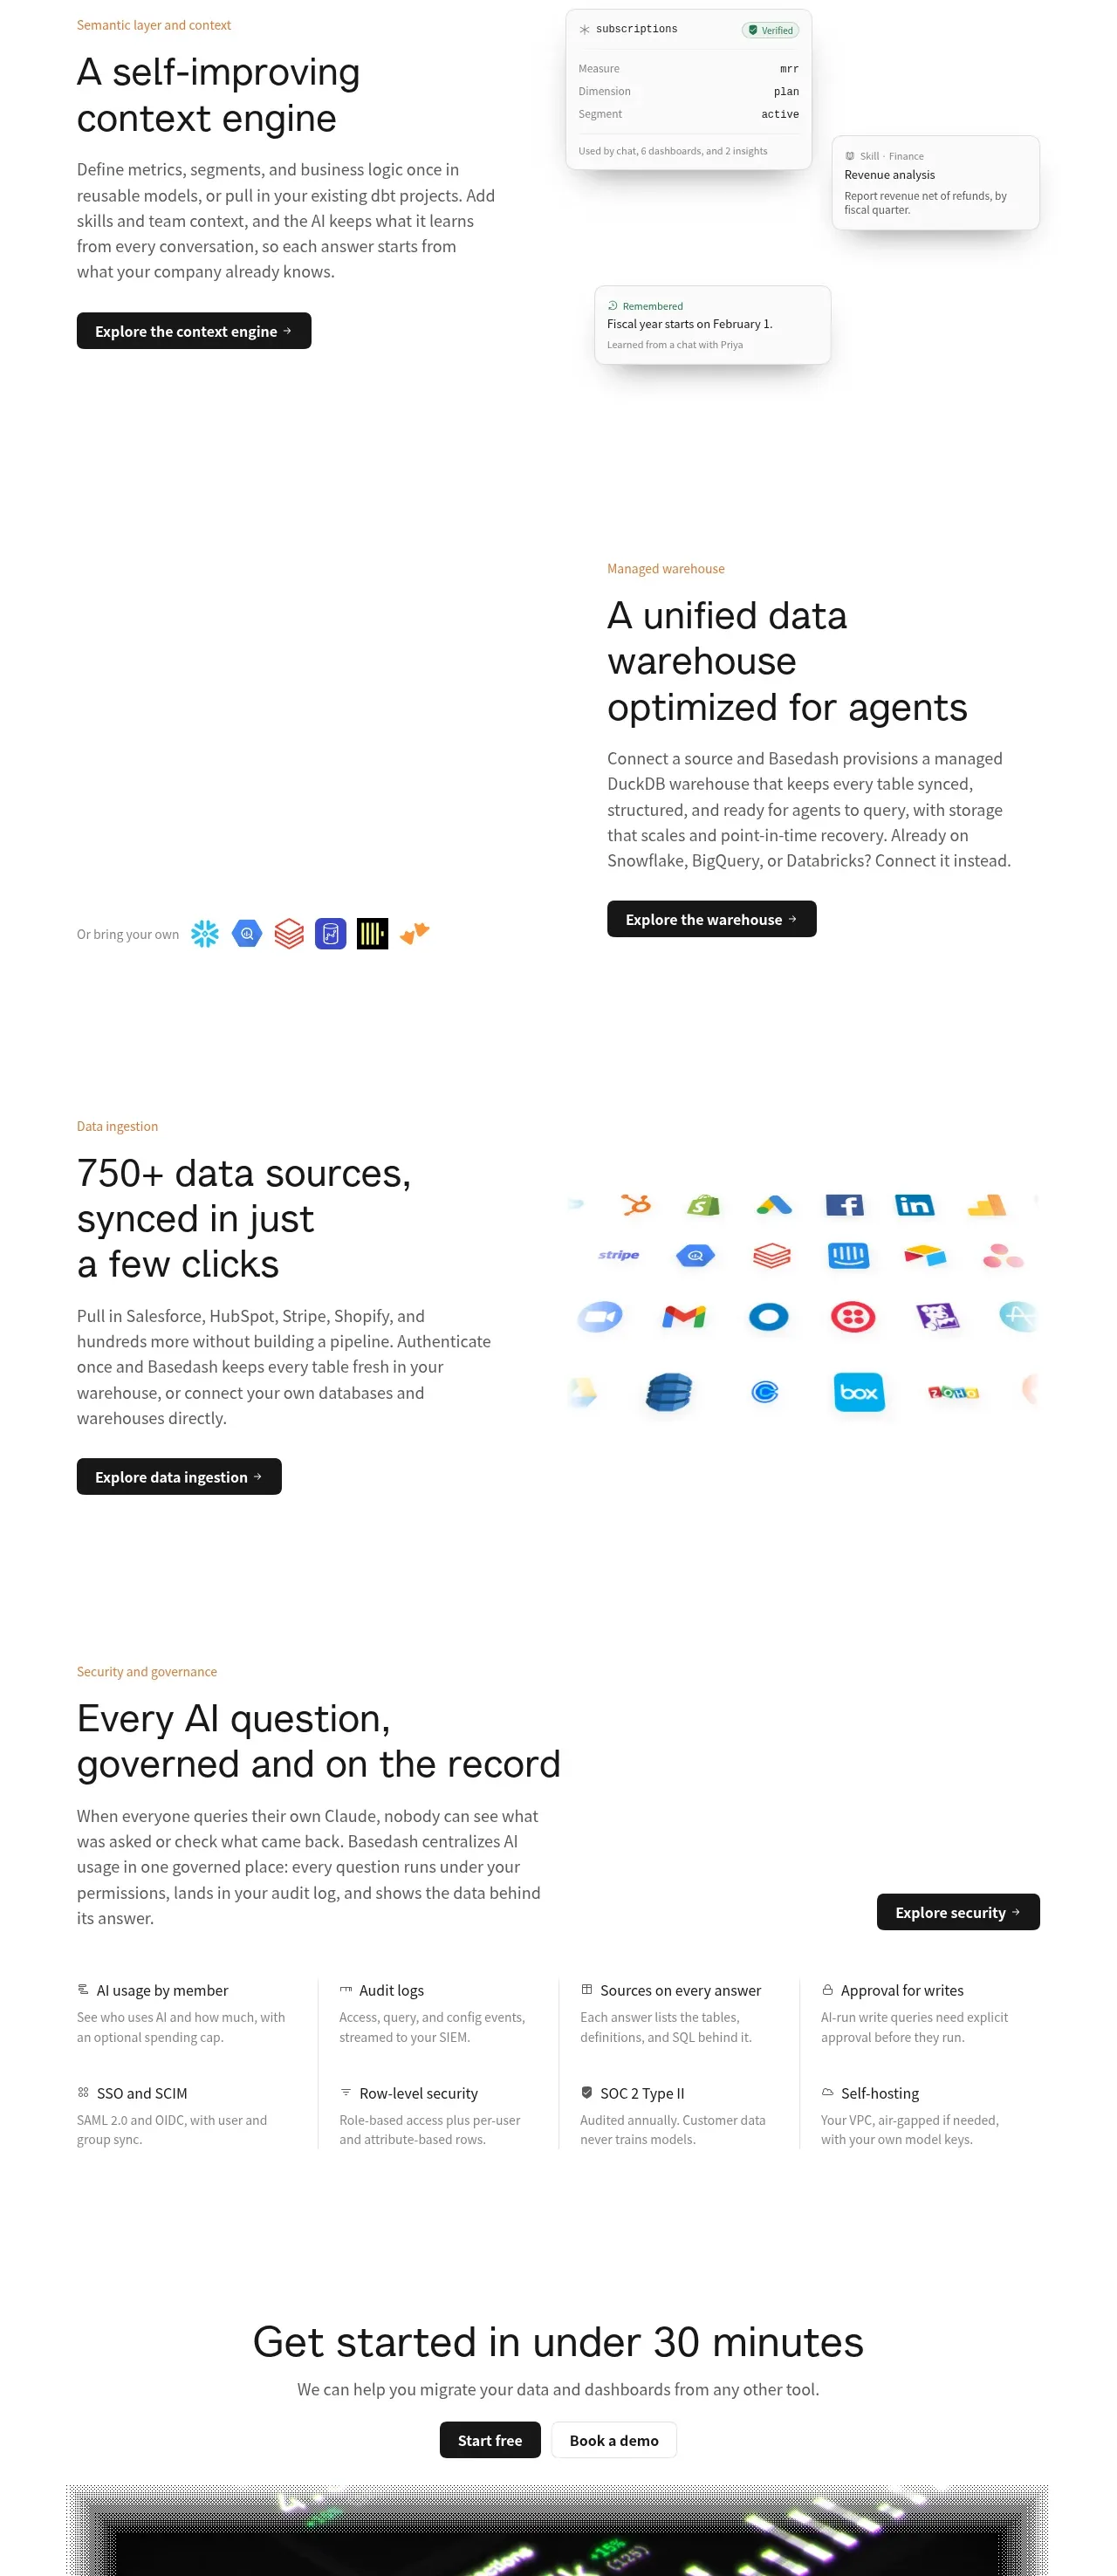 Platform foundation features
Basedash View-only members · Feature grid