 kage
throxy.com
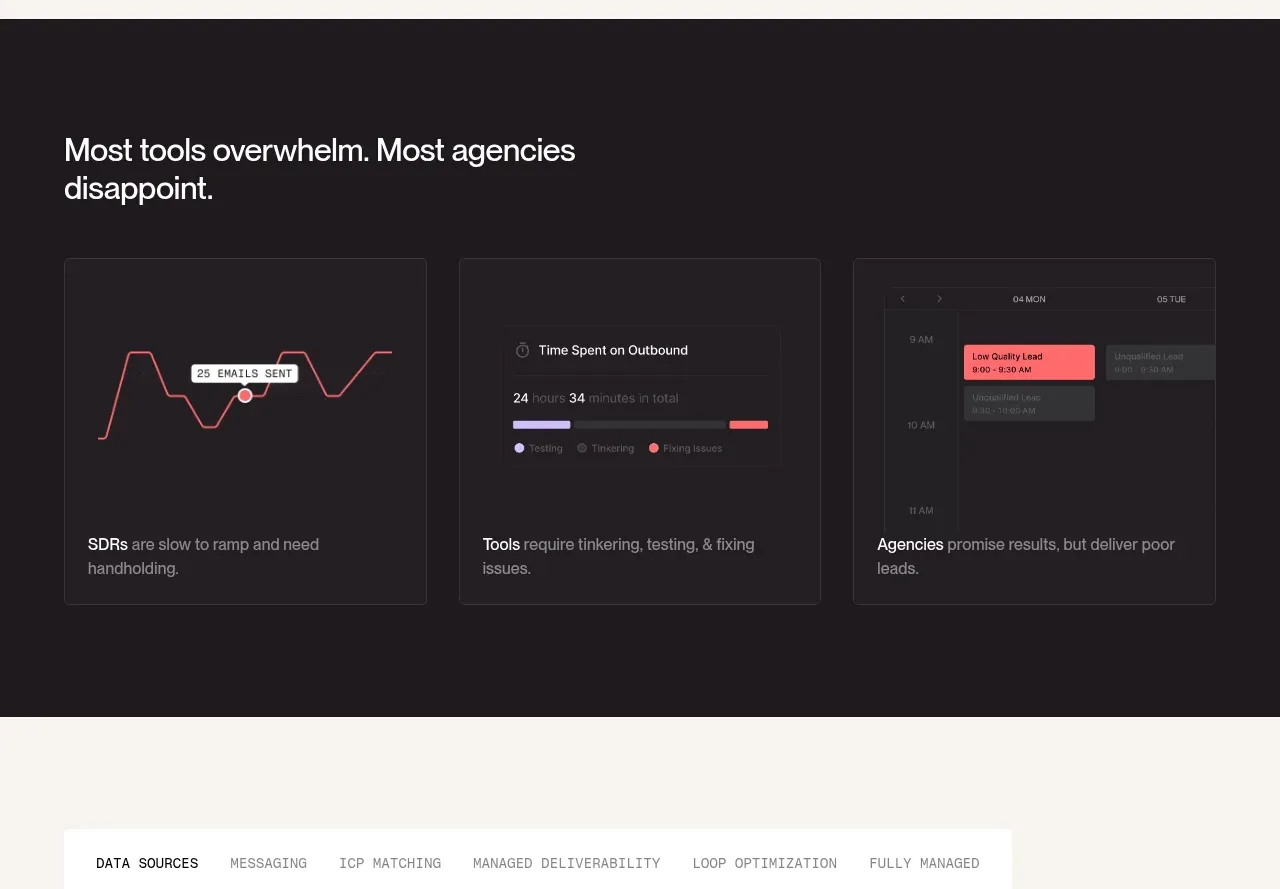
Design analysis
A dark comparison section contrasts three common failure modes using simple analytical mini-visuals and short explanatory captions.
Prompt preview
## Reference images

Study these alongside the description below: hierarchy, rhythm, spacing, colour. Build for the product you are asked about, using this design language.

- Component: https://kage-design-assets.t3.tigrisfiles.io/components/throxy/4d577be3-3944-4c06-b2f6-094c0e693ab7-1793253970-6.webp
- Full page it was cut from: https://kage-design-assets.t3.tigrisfiles.io/screenshots/throxy/4d577be3-3944-4c06-b2f6-094c0e693ab7-1793253814515-full.webp
- Component on Kage: https://kage.design/component/throxy-feature-grid-4

### Before you start
Ask what the user's product, audience, and brand are, then apply these principles to that product.

Create a dark section with a concise heading followed by three equal comparison cards. Each card should contain a small abstract data visualization—such as a line, timeline, or calendar fragment—built with CSS/SVG from generic shapes, then a bold category label and a short explanation of the problem. Use near-black #1F1B1E, thin #373137 borders, white text, muted gray copy, and one coral or lavender highlight used sparingly. Keep diagrams legible at small sizes, align all card bottoms, and avoid making the charts imply unsupported quantitative claims.

Never: use logos, product names, copy, illustrations, or imagery from the reference.
More components
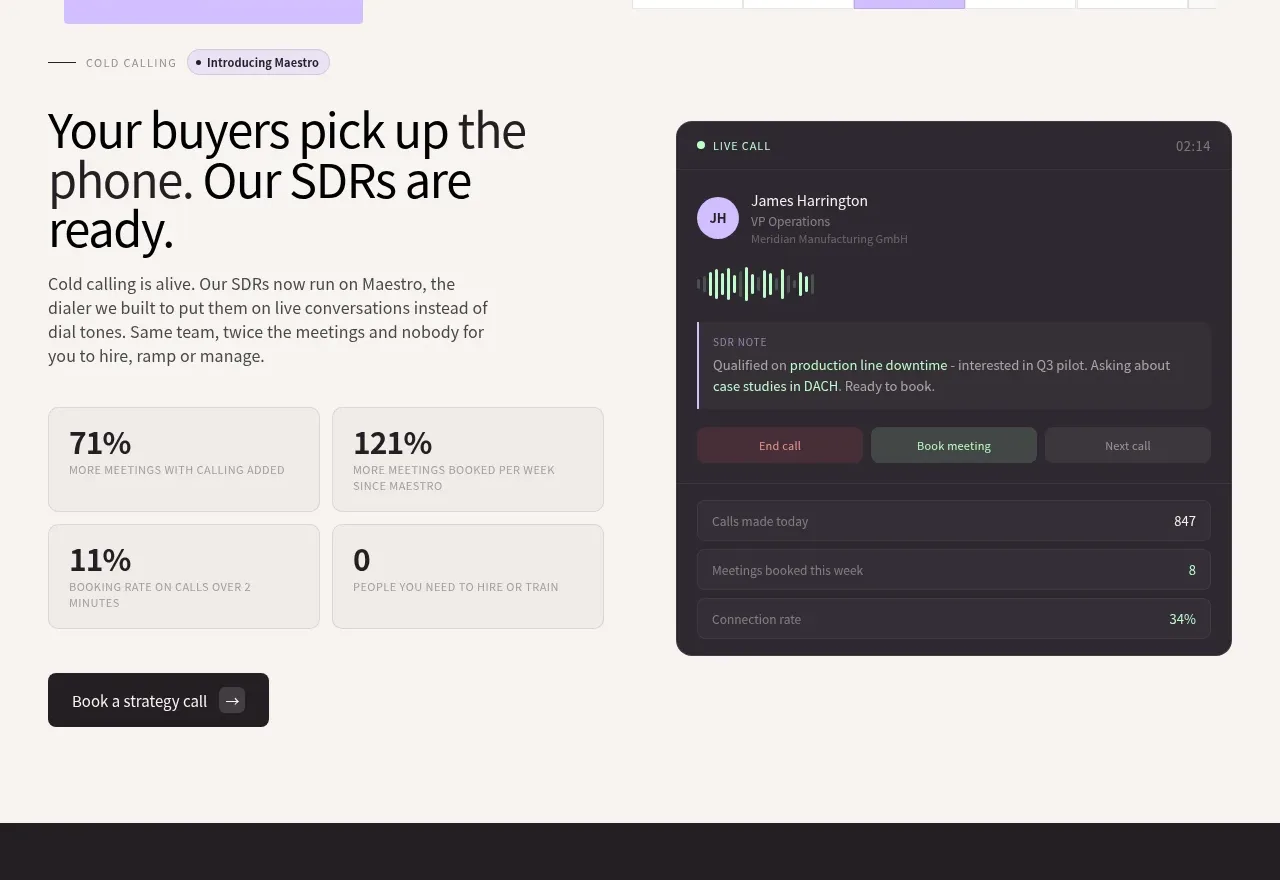
 Cold-calling performance section
throxy · Feature grid
 Outbound partner benefits
throxy · Feature grid
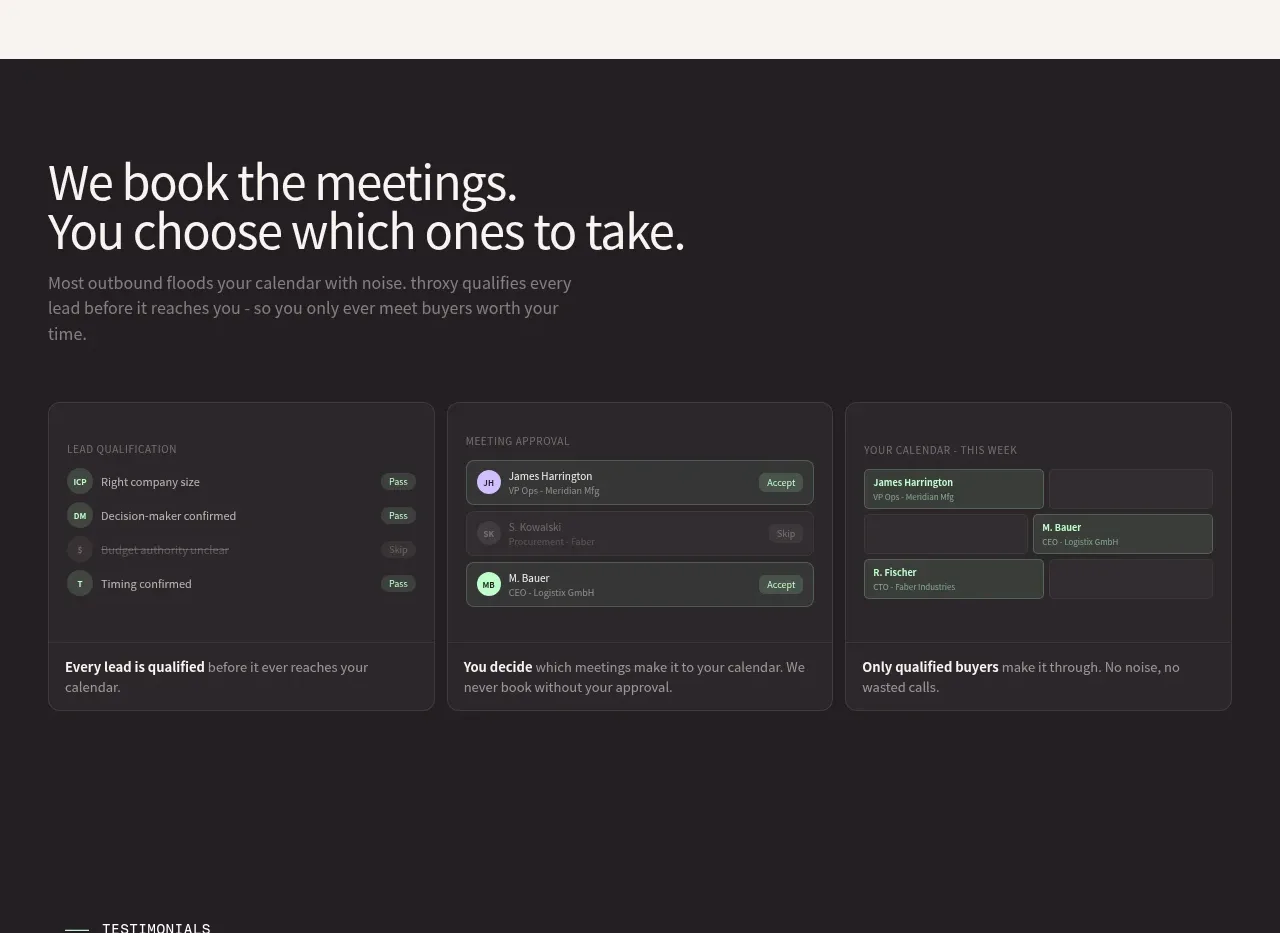 Qualification workflow cards
throxy · Feature grid
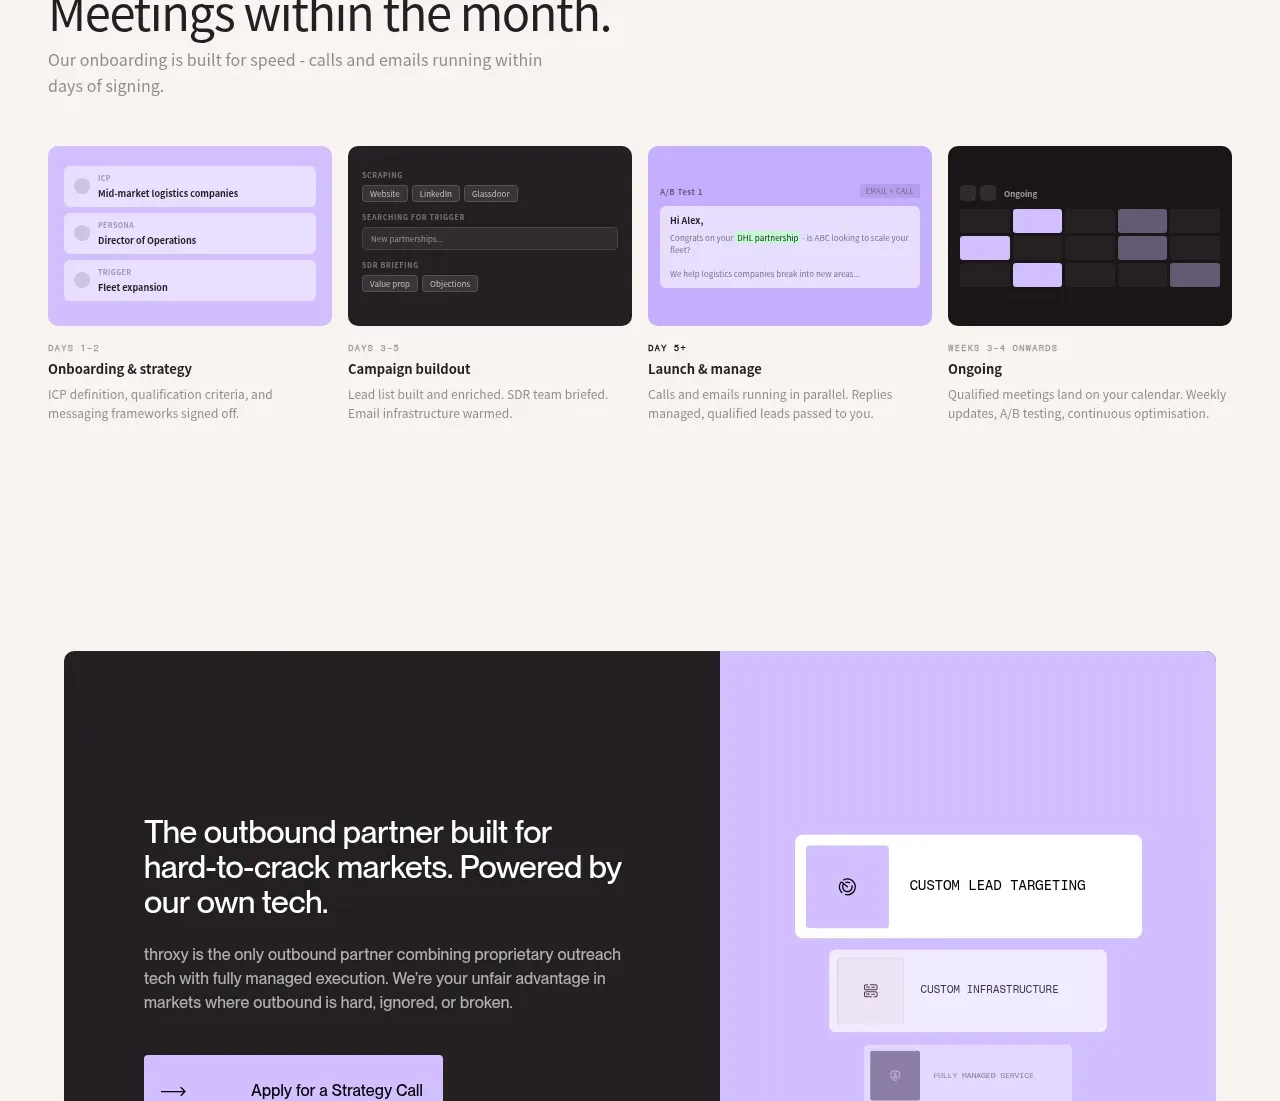 Rapid onboarding timeline
throxy · Feature grid
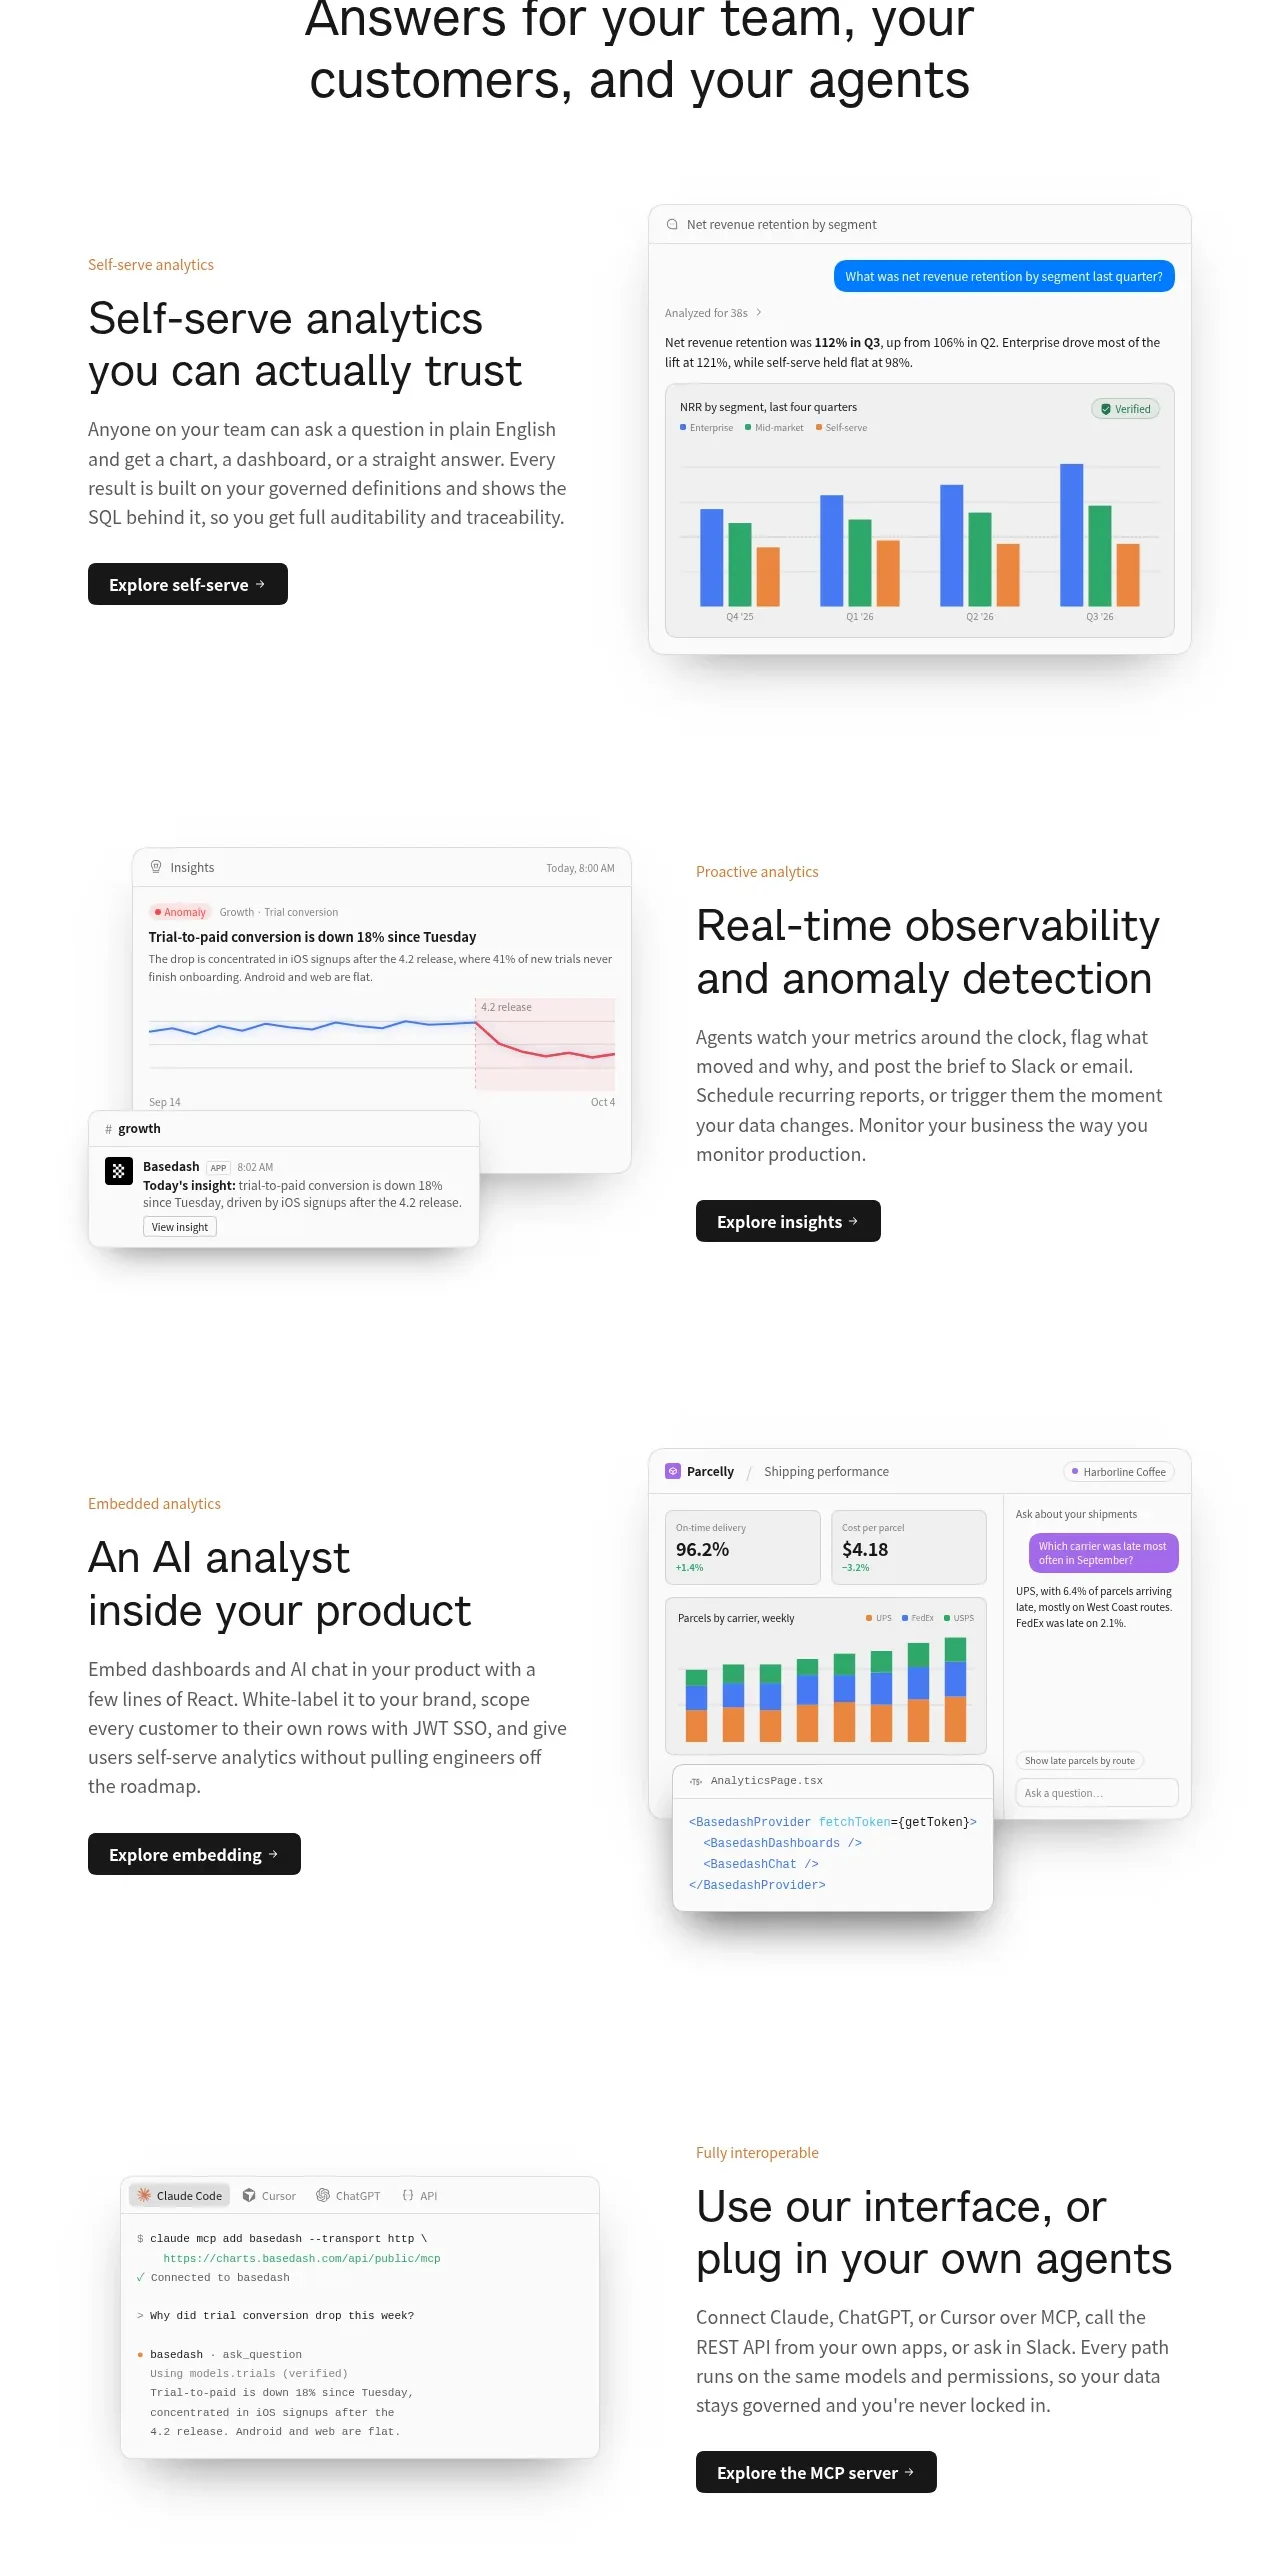
 Analytics capability showcase
Basedash View-only members · Feature grid
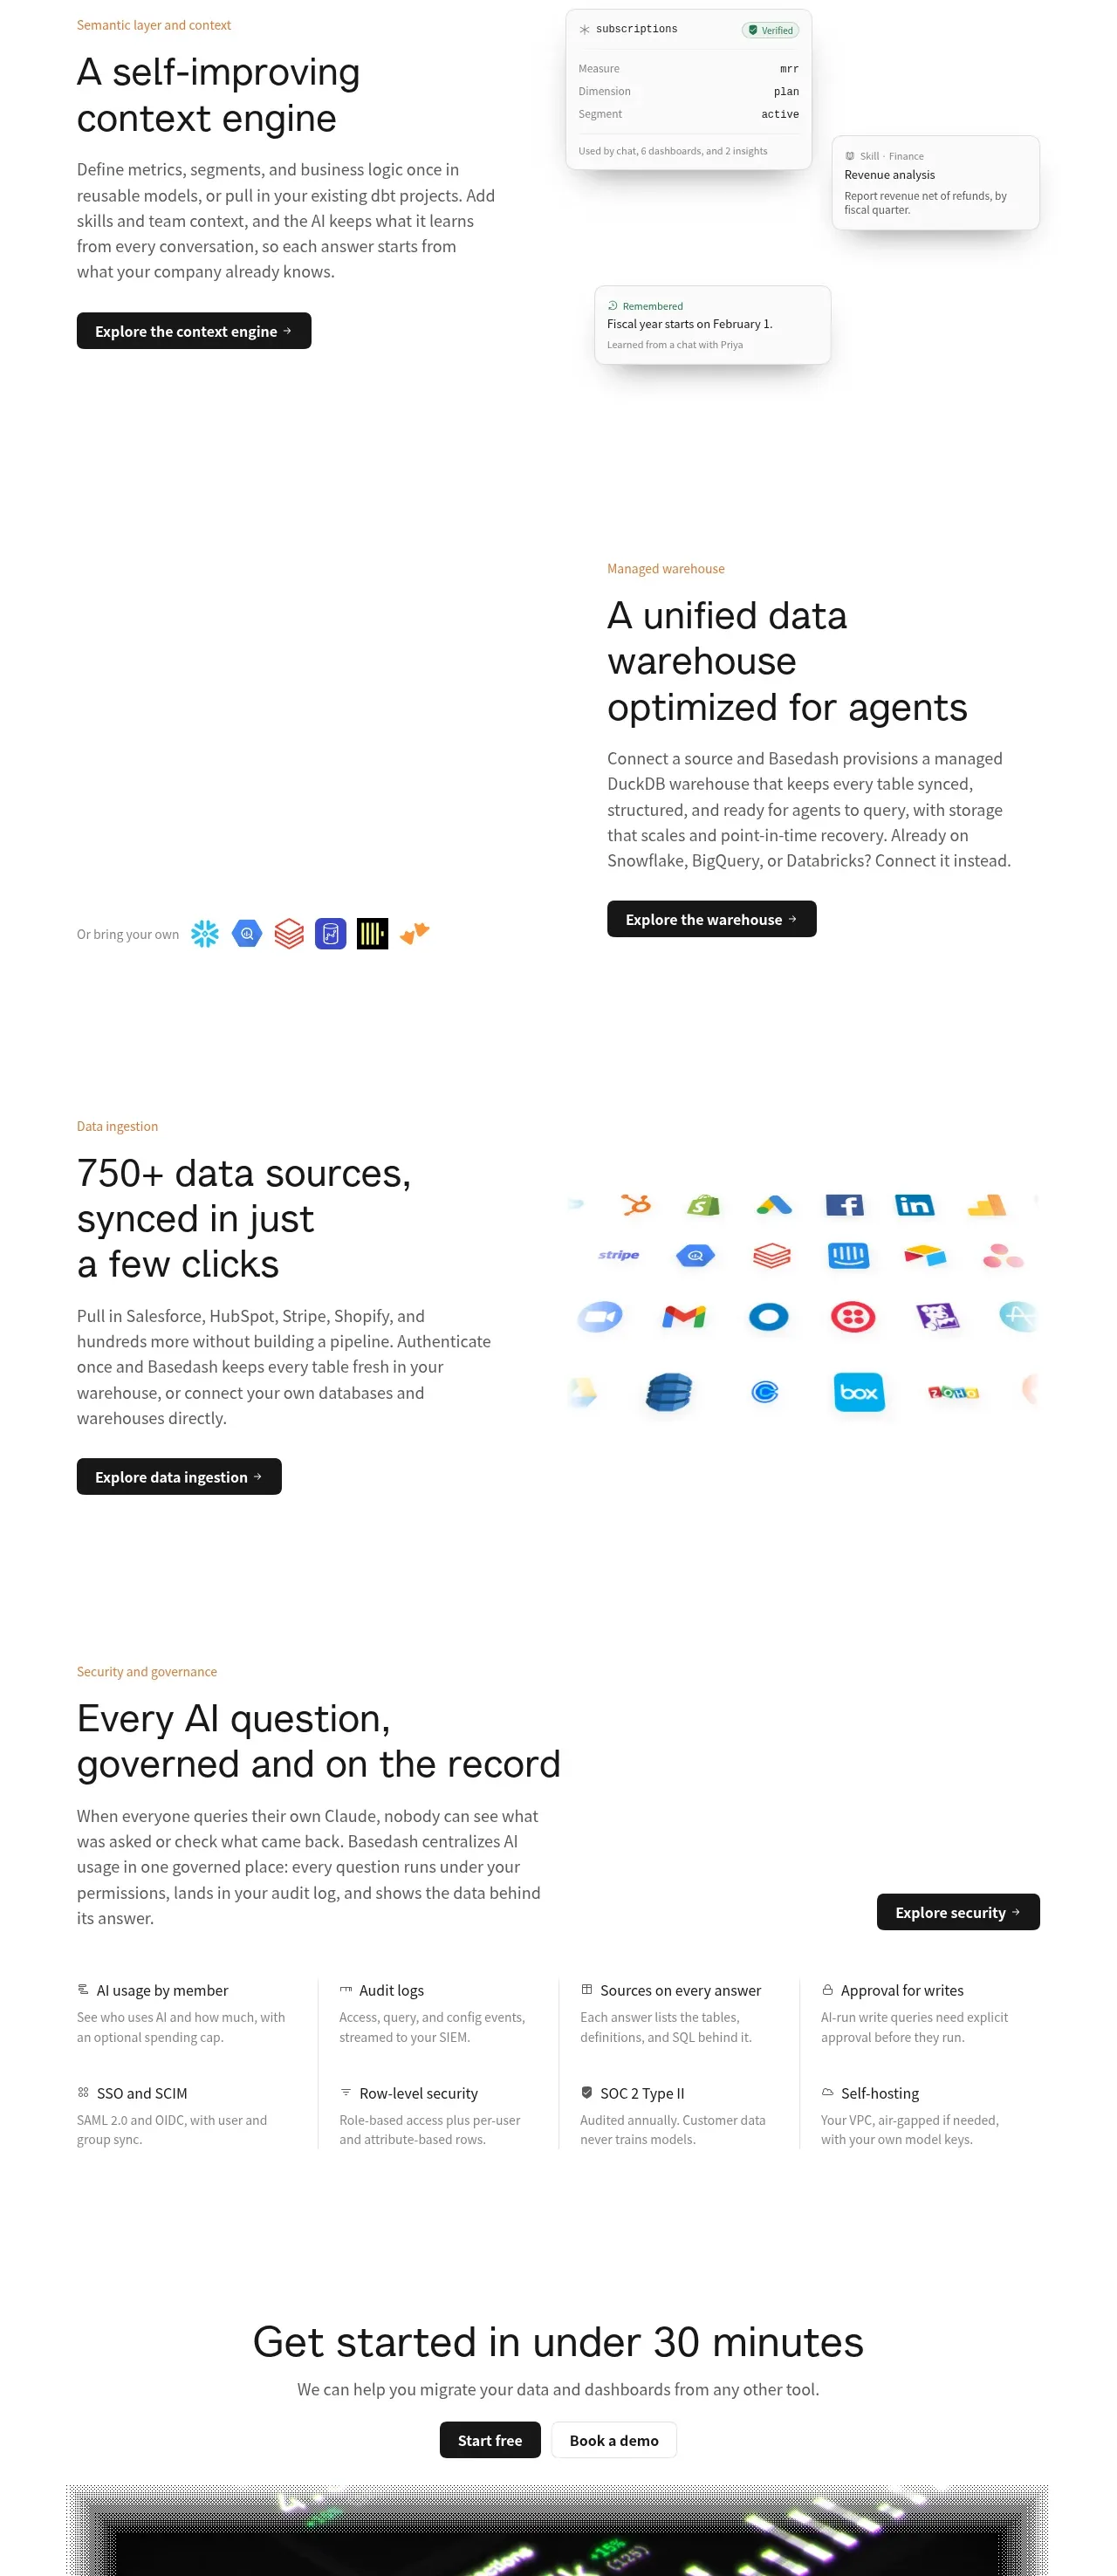 Platform foundation features
Basedash View-only members · Feature grid