 kage
kage
fplxi.com

Design analysis
A compact, responsive dashboard grid that pairs a dominant visual feature with supporting data cards. Clear card headers, restrained borders, role-based colour accents, and dense but readable tables make multiple analytical views feel like one coherent product surface.
Prompt preview
## Reference images

Study these alongside the description below: hierarchy, rhythm, spacing, colour. Build for the product you are asked about, using this design language.

- Component: https://kage-design-assets.t3.tigrisfiles.io/components/fplxi-com/54b8421e-1a9f-4884-bebf-8d70ddcd8ef8-1789073156-4.webp
- Full page it was cut from: https://kage-design-assets.t3.tigrisfiles.io/screenshots/fplxi-com/54b8421e-1a9f-4884-bebf-8d70ddcd8ef8-1789073135-full.webp
- Component on Kage: https://kage.design/component/fplxi-feature-grid

# Build a product-specific analytical feature grid

## Before you start
Ask me what my product does, who it is for, and what its brand personality, colours, typography, and content priorities are. Then apply the design principles below to my product rather than recreating the reference literally.

## Goal
Create a responsive feature-grid section for a data-rich product dashboard. The grid should make one primary insight feel prominent while giving users fast access to several supporting views. Use realistic content for my product, but keep the structure adaptable to different domains such as finance, operations, analytics, productivity, or sports.

## Layout and alignment
- Use a pale, warm-neutral page background, approximately `#f5f5f3`, with a centered max-width container around 1200–1280px.
- Arrange the section as a 12-column CSS grid with a generous but compact gap of 16px.
- On wide screens, make the primary feature span 8 columns and the secondary feature span 4 columns. Place two supporting cards beneath them: the larger card spans 8 columns and the smaller analytical summary spans 4 columns.
- Keep every feature inside a white card with a consistent outer border and shared corner treatment. Align card headers, dividers, and inner content to a common vertical rhythm.
- Collapse to one column below roughly 800px. Preserve the order of importance: primary feature, secondary feature, supporting table, summary chart.
- Give each card a header row with a clear title on the left, muted explanatory metadata below it, and a compact text link or icon action on the right.
- Use internal padding of 16px on desktop, reducing to 12–14px on small screens. Avoid excessive empty space, but never let dense data touch card edges.

## Typography hierarchy
- Use a clean contemporary sans-serif with strong numerical legibility; use the user's brand font if available.
- Card titles: 14–15px, medium weight, near-black `#171717`.
- Supporting metadata and subtitles: 12–13px, regular weight, muted grey `#929292`.
- Main data labels: 13–14px, medium weight, `#202020`.
- Numbers, scores, rankings, and table values: 13–14px with tabular numerals and enough contrast to scan quickly.
- Use restrained uppercase labels only for small category headings, at 10–11px with letter spacing around 0.08em and muted grey.
- Keep line heights around 1.35–1.5 and avoid oversized marketing typography inside this analytical component.

## Primary visual feature
- Make the dominant card contain a large contextual visualisation or diagram rather than a generic chart. It could be a map, canvas, timeline, workflow, plan, system state, or domain-specific model output.
- Give the visual a soft tinted surface, approximately `#e8f6ec`, with subtle tonal bands or grid lines in a slightly darker green such as `#d8eedf`. Adapt this hue to the user's brand if necessary.
- Place compact white floating data tiles over or within the visual. Each tile should include a tiny category label, a prominent entity/value, and an optional score or status.
- Use modest shadows such as `0 2px 8px rgba(20, 30, 25, 0.08)` and a 1px border `#e2e5e2`; do not make tiles look like glossy widgets.
- The visual should communicate hierarchy and relationships at a glance. Keep labels short and make the key output more visually prominent than secondary detail.
- Add a subtle footer row beneath the visual for a secondary action or drill-down affordance, separated by a top border.

## Supporting data cards
- Use compact tables or ranked lists with consistent row heights of approximately 36–38px.
- Separate rows with very light dividers such as `#ededeb`; avoid heavy grid lines.
- Align numeric columns right and keep labels left aligned. Use fixed-width or tabular columns so values scan vertically.
- Represent categories with small rounded pills or badges. Use muted, low-saturation backgrounds and dark text rather than saturated fills. Example accents: lavender `#e8e4fb` / `#6258ad`, peach `#f7e9df` / `#92694c`, pale blue `#dfeff2` / `#397581`, pale yellow `#f5efd7` / `#88722f`, pale rose `#f6e2e5` / `#994d5b`.
- Use a compact legend or column labels where needed, but do not repeat information already obvious from the card title.
- For a list of paired entities or events, keep the two sides visually balanced with a small status indicator between them and a muted timestamp or secondary value aligned at the far right.

## Charts and summary metrics
- Prefer simple, low-ink visualisations: small bars, sparklines, progress indicators, or compact trend lines.
- Use one primary accent colour, approximately `#6866d9` or the user's brand accent, with a lighter tint for secondary states.
- Keep chart axes and labels quiet; let the data carry the emphasis.
- Put summary metrics in a lightly tinted footer or bottom strip, separated with a border. Use a small uppercase label above each value and avoid decorative iconography unless it carries meaning.

## Colour, borders, and radius
- Base background: approximately `#f5f5f3`.
- Card surface: `#ffffff`.
- Main text: `#171717`; secondary text: `#8d8d8d`.
- Card border and dividers: `#e5e5e2` and `#eeeeeb`.
- Use one brand accent for links, active states, charts, or key scores; keep all category colours soft and semantic.
- Use 10–12px corner radius for cards and 6–8px for pills and floating data tiles. Keep the radius consistent across the component.
- Shadows should be nearly imperceptible and used only for elements layered over a visual surface.

## Interaction and responsive behaviour
- Make text links, chart areas, rows, and floating tiles visibly interactive with hover, focus, and pressed states.
- On hover, use a subtle background tint or border accent rather than a dramatic animation. Keep transitions around 150–200ms.
- Make rows keyboard accessible and provide clear focus rings using the brand accent.
- On narrow screens, allow wide tables to scroll horizontally inside the card rather than shrinking typography below readable sizes.
- Preserve meaningful ordering and provide accessible labels for charts, badges, status dots, and icon-only actions.
- If the visual contains selectable entities, use a clear selected state with a slightly stronger border and a light accent background.

## Content guidance
- Use concise, domain-specific labels supplied by the product. Show enough realistic data to demonstrate density without overcrowding the card.
- Prioritise one headline insight, then supporting context, then drill-down detail.
- Keep actions phrased as short verbs or destinations, such as “View details”, “Open report”, or “Compare”.

## Never
- Never copy the reference's logos, product names, football terminology, player names, fixture names, or exact copy.
- Never reuse the reference's illustrations, imagery, diagrams, icons, or visual assets; create an original visual appropriate to my product.
- Never reproduce the exact arrangement or data values if a different structure better serves my product.
- Never use decorative gradients, excessive shadows, noisy borders, or saturated category colours that reduce readability.
- Never sacrifice accessibility, responsive behaviour, or semantic HTML for visual similarity.
More components
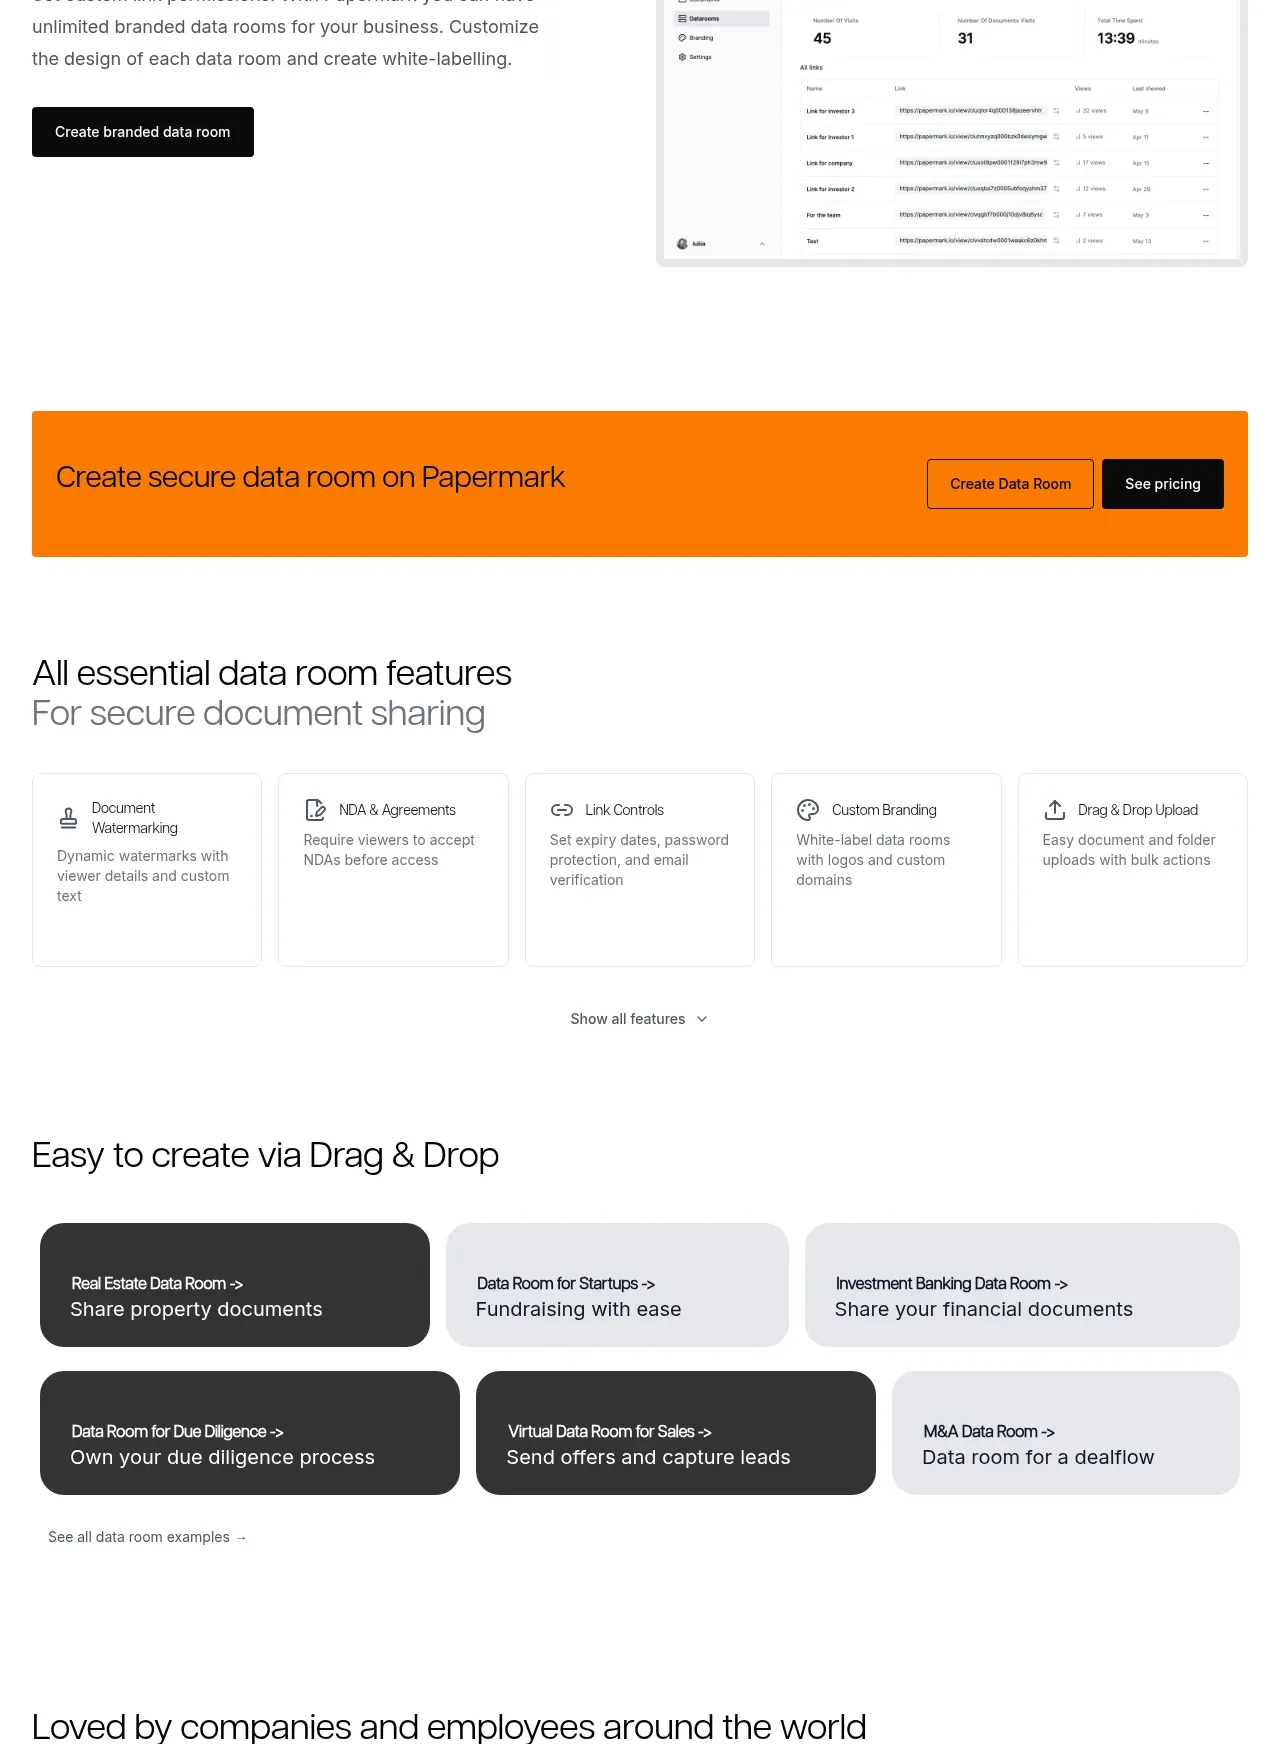
 Workflow demonstrations
Papermark Data Rooms · Feature grid
Workflow demonstrations
Papermark Data Rooms · Feature grid
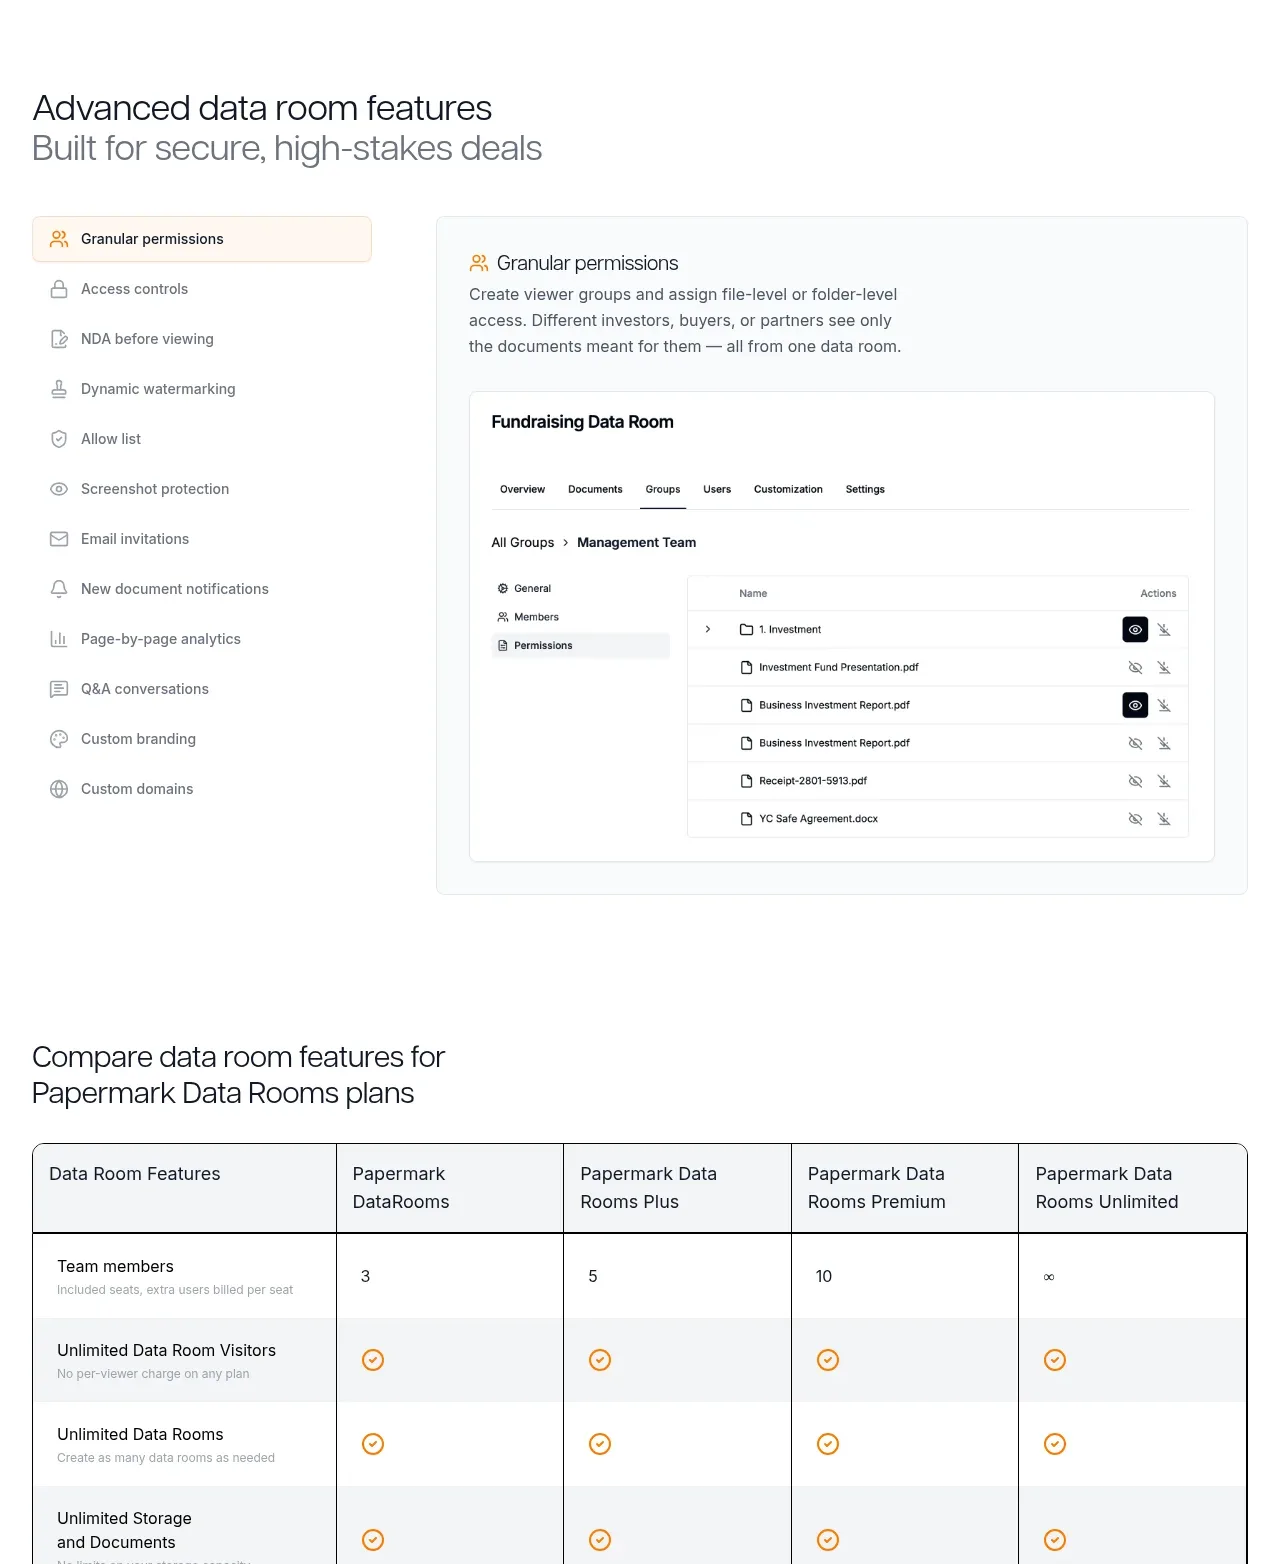 Advanced data-room features
Papermark Data Rooms · Feature grid
Advanced data-room features
Papermark Data Rooms · Feature grid
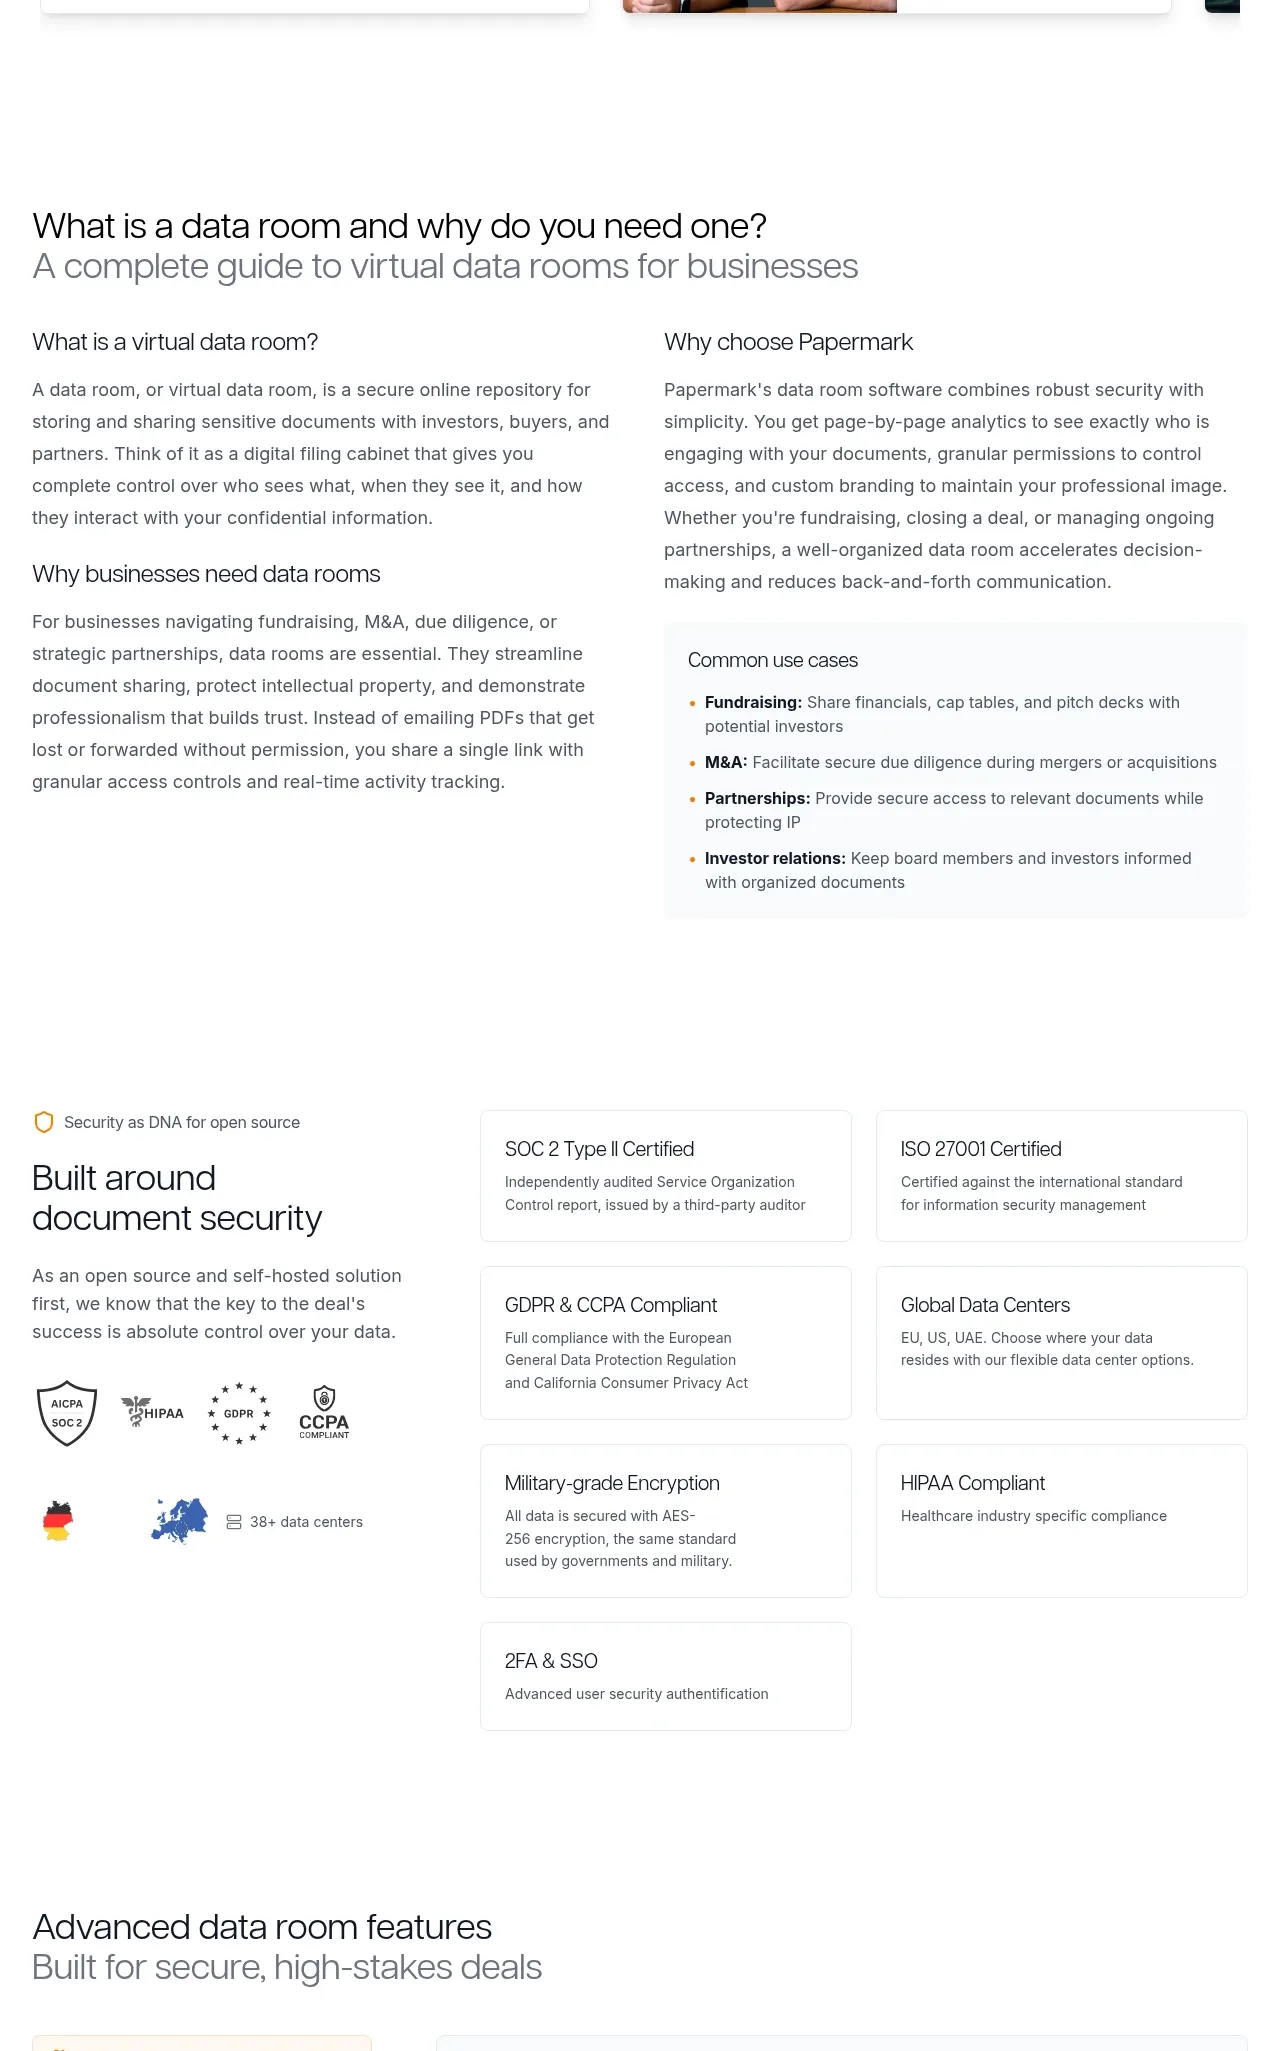 Data-room education and security overview
Papermark Data Rooms · Feature grid
Data-room education and security overview
Papermark Data Rooms · Feature grid
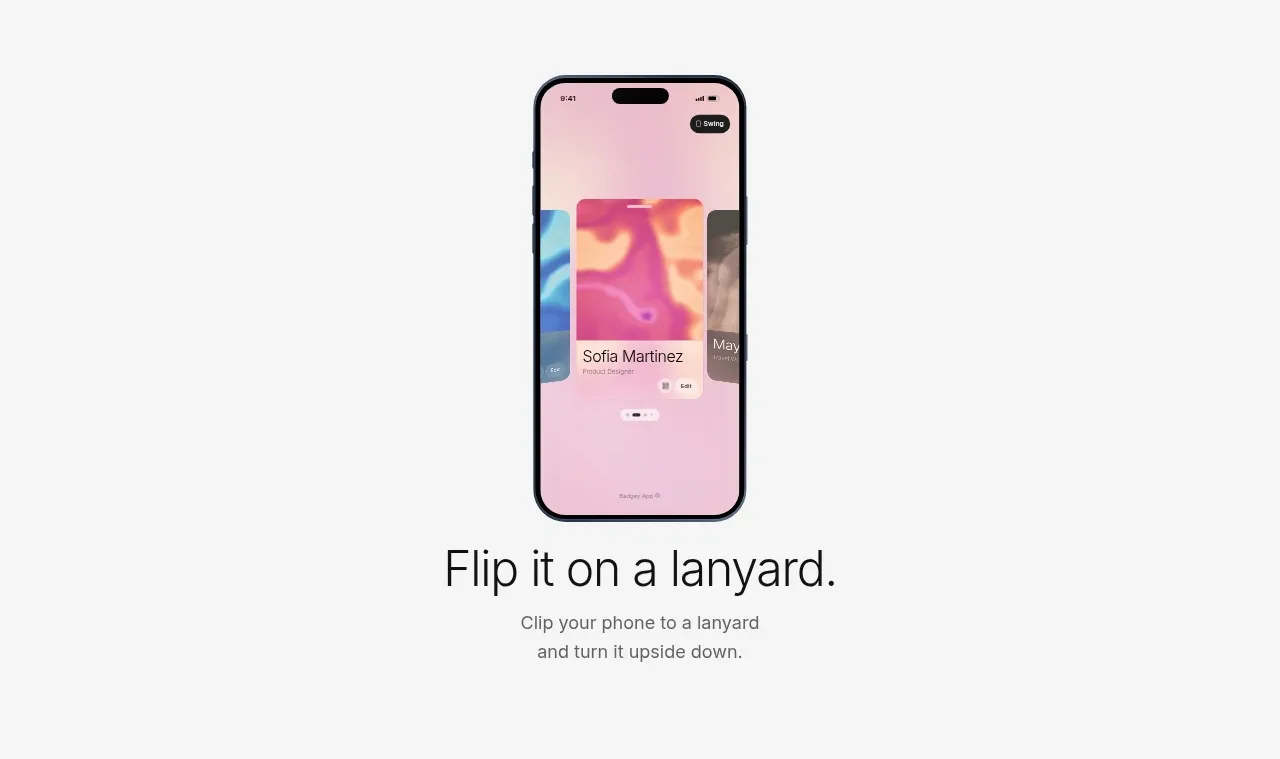
 Lanyard use-case feature
Badgey · Feature grid
Lanyard use-case feature
Badgey · Feature grid

 Four value propositions
Clips by Plastic · Feature grid
Four value propositions
Clips by Plastic · Feature grid
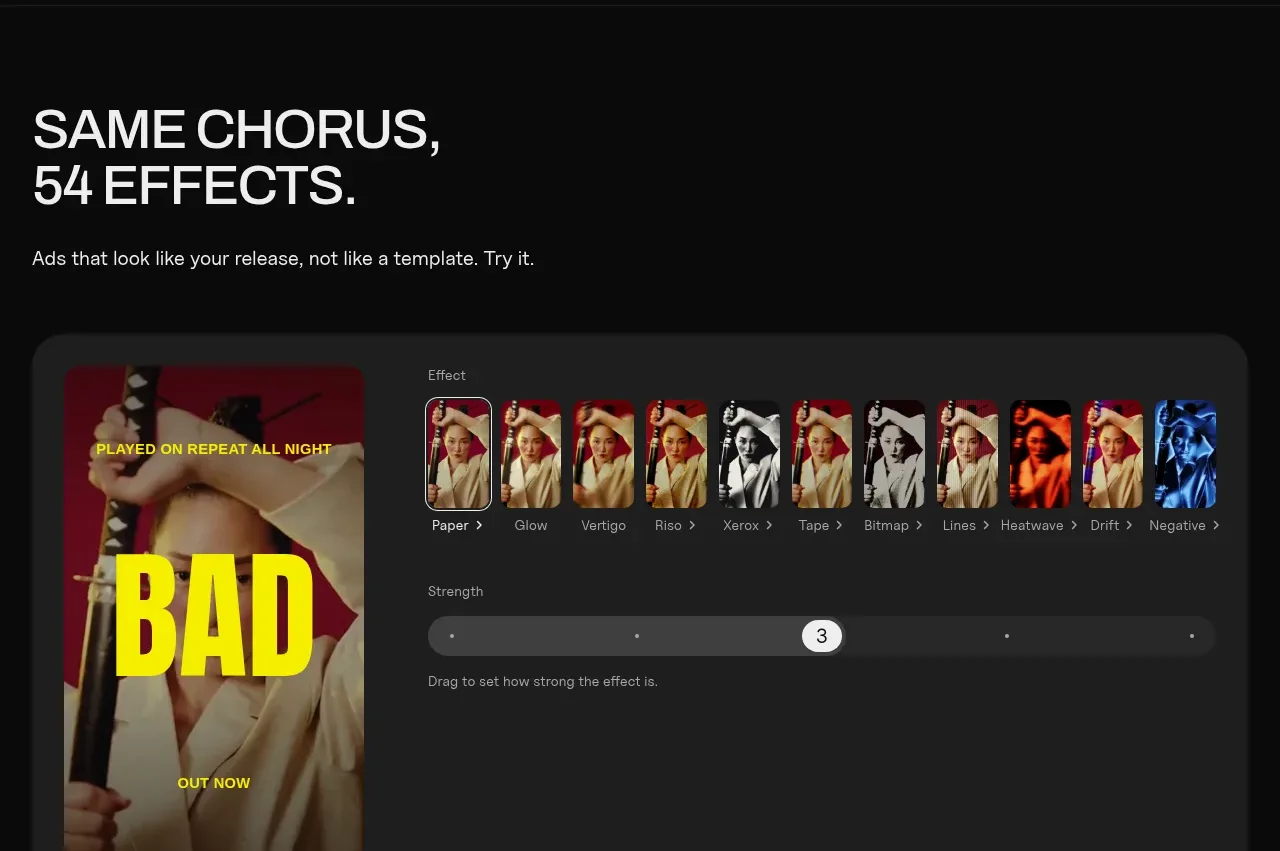 Effects and customization panel
Clips by Plastic · Feature grid
Effects and customization panel
Clips by Plastic · Feature grid