 kage
kage
stripe.com

Design analysis
A dark, editorial product section that pairs a concise confidence statement with an atmospheric flowing-line visual and three high-impact operational metrics. The restrained grid, luminous gradient accents, and oversized figures make technical scale feel tangible without overwhelming the content.
Prompt preview
## Reference images

Study these alongside the description below: hierarchy, rhythm, spacing, colour. Build for the product you are asked about, using this design language.

- Component: https://kage-design-assets.t3.tigrisfiles.io/components/stripe-com/f883ce83-9776-477f-9170-0bb4400c0ec7-1789067514-8.webp
- Full page it was cut from: https://kage-design-assets.t3.tigrisfiles.io/screenshots/stripe-com/f883ce83-9776-477f-9170-0bb4400c0ec7-1789060217-full.webp
- Component on Kage: https://kage.design/component/stripe-testimonials

# Before you start
Ask what the user's product is, who it serves, and what its brand personality and visual system are. Then apply the principles below to create an original version for that product rather than reproducing the reference.

## Build this section
Create a dark, high-confidence product proof section that communicates reliability at scale through one concise narrative, an abstract data-inspired visual, and a row of three supporting metrics. The section should feel appropriate for a sophisticated software product and should transition naturally into the next product-content section.

## Design language

### Layout and alignment
- Use a full-width deep navy section with a centered max-width content container of approximately 1180–1280px.
- Align all text and metrics to the same left and right content rails; use a 12-column grid on desktop and collapse to one column on small screens.
- Place the lead statement in the upper-left area, constrained to roughly 650–760px so it reads as a compact editorial paragraph rather than a long headline.
- Use a large, low-contrast abstract visual field behind or beneath the statement. It should suggest flowing data, throughput, or network activity using thin curved lines, but remain subordinate to the content.
- Place three metrics in an evenly distributed row below the visual. Each metric should have a large value and a short explanatory label.
- Add a subtle horizontal divider at the section boundary and preserve generous vertical breathing room before the next section.
- On mobile, stack the metrics vertically or use a two-column-first layout only if it remains readable; reduce the visual height and keep the lead copy near the top.

### Typography hierarchy
- Use a clean modern sans-serif with crisp rendering and slightly tight headline tracking.
- Make the lead statement approximately 24–28px on desktop, 20–23px on mobile, with 1.15–1.25 line height.
- Emphasize the opening benefit phrase in near-white while rendering the supporting sentence in a muted blue-gray. This contrast should feel intentional, not like separate blocks.
- Make metric values large and prominent, approximately 44–52px desktop and 34–40px mobile, with a medium or regular weight rather than an overly bold display style.
- Use 15–17px labels in a bright but secondary tone, with comfortable spacing below the value.

### Colour
- Use a deep navy background close to #0B1738 or #0C183A.
- Use near-white text around #F5F7FF for primary copy.
- Use muted steel blue for supporting copy, around #91A4C8.
- Give metric values a restrained luminous gradient moving through soft peach, pink, violet, and periwinkle tones, such as #F3B0AE → #D66BE8 → #8F88FF.
- Keep decorative lines low-opacity, using violet, magenta, and warm coral highlights over navy. The brightest glow should sit near the visual centre and fade smoothly toward the edges.
- Use a subtle border or divider around #1B2A50; avoid pure black and avoid overly saturated surfaces.

### Visual treatment
- Create an abstract flowing-line composition from many fine, closely spaced curves or paths. The lines should form a broad wave or crossing ribbon, with a soft blurred glow in selected areas.
- The visual can be implemented with SVG, canvas, CSS gradients, or generated paths, but it must be responsive and performant. Prefer opacity and blur layering over heavy image assets.
- Keep the visual decorative and non-interactive unless the user's product calls for data exploration. It should not compete with the metrics or make text hard to read.

### Borders, spacing, and radius
- Use generous section padding: approximately 64–88px top and bottom on desktop, and 44–60px on mobile.
- Leave approximately 48–72px between the lead copy and the metric row, adjusting around the visual composition.
- Use 1px low-contrast borders for section boundaries.
- Avoid card-heavy styling; if metric groups need separation, use spacing or very subtle vertical rules rather than prominent containers.
- Keep corners mostly square or use a restrained 8–12px radius only for any supporting controls introduced by the user's product.

### Interaction and responsive behaviour
- The section should be static by default, with optional subtle motion in the decorative lines: slow, ambient movement or a gentle opacity shift, never rapid animation.
- Respect `prefers-reduced-motion` and provide a fully static fallback.
- If metrics animate on entry, count them only once and keep the transition short and understated.
- Ensure the contrast of all text meets accessibility standards and that the abstract visual never obscures content.
- On narrow screens, preserve the reading order: statement, visual, metrics. Ensure large values do not overflow and labels remain associated with their values.

## Never
- Never copy the reference's logos, product names, brand names, or company-specific terminology.
- Never reuse the reference's exact marketing copy, metric values, statistics, or claims.
- Never reproduce the reference's exact illustration, wave artwork, line pattern, or asset; create a new abstract visual appropriate to the user's product.
- Never use imagery, illustrations, or decorative assets from the reference.
- Never make unsupported claims for the user's product; use clearly editable placeholder content or ask for real proof points.
- Never sacrifice readability, accessibility, or responsive behaviour for visual similarity.
More components
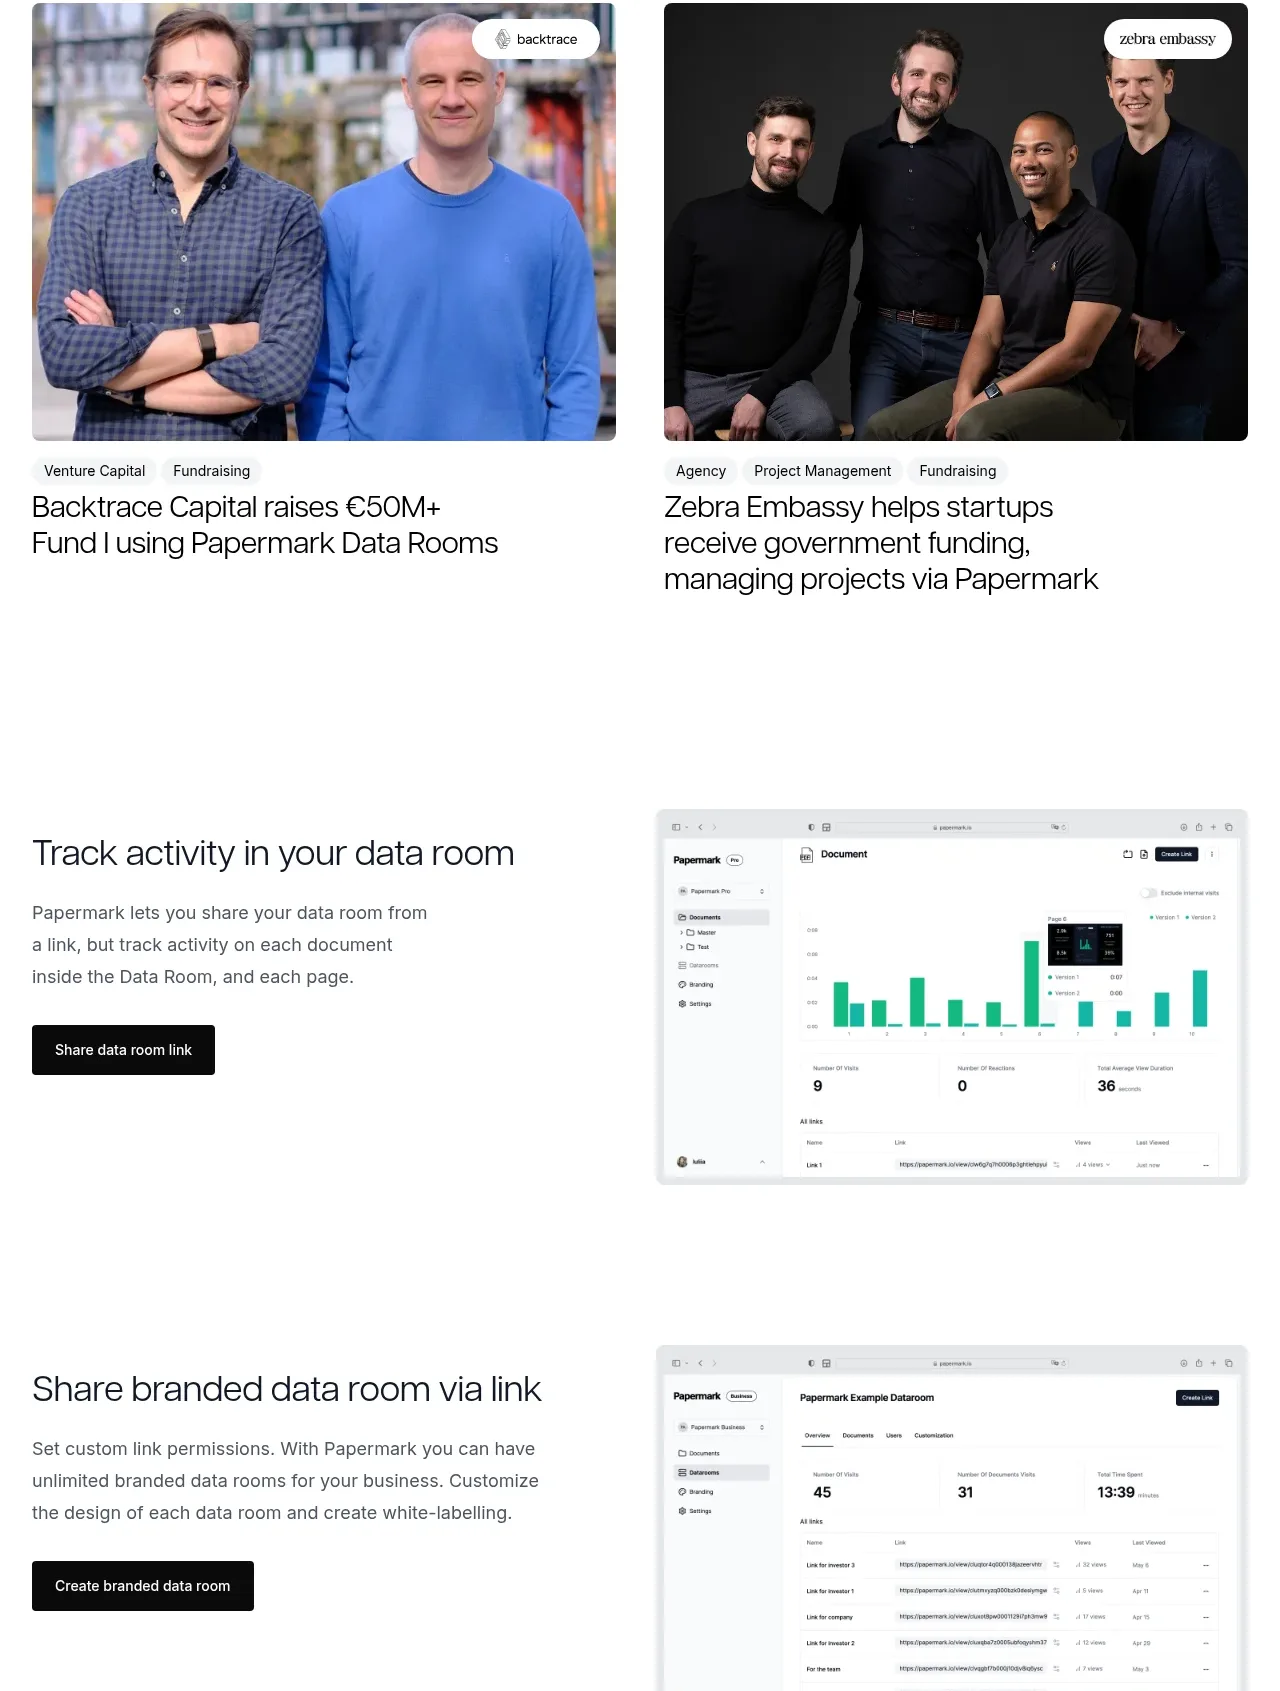
 Customer success stories
Papermark Data Rooms · Testimonials
Customer success stories
Papermark Data Rooms · Testimonials
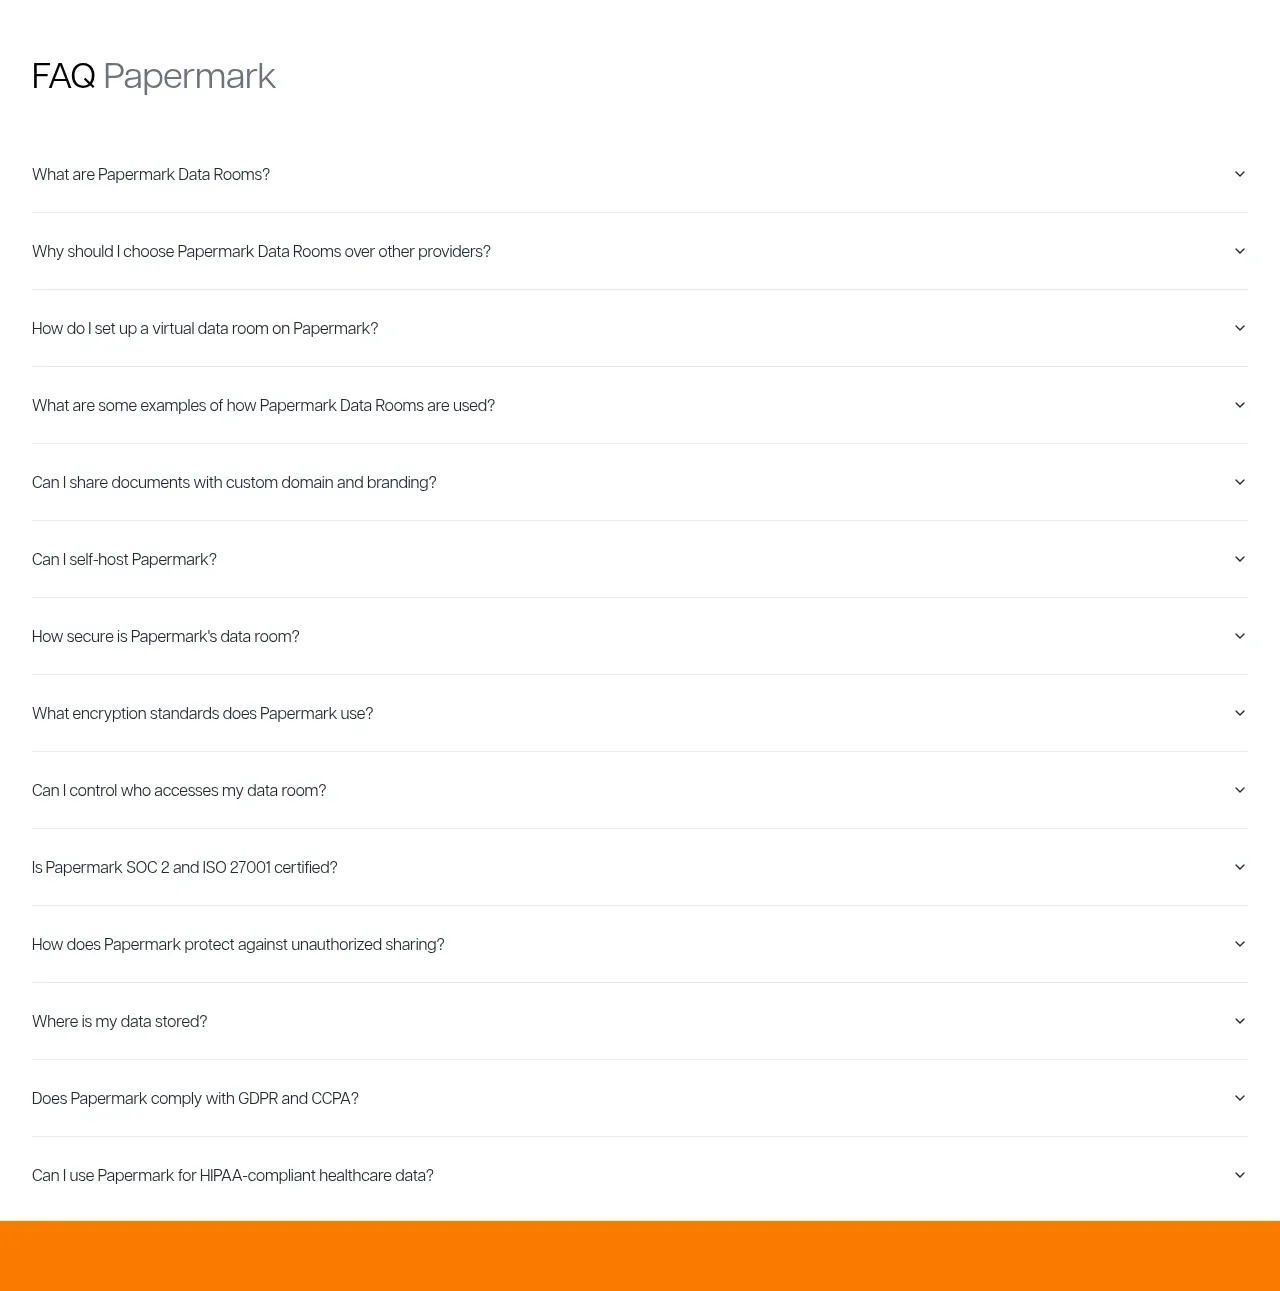 Employee and community testimonials
Papermark Data Rooms · Testimonials
Employee and community testimonials
Papermark Data Rooms · Testimonials

 Customer quote
Clips by Plastic · Testimonials
Customer quote
Clips by Plastic · Testimonials
M
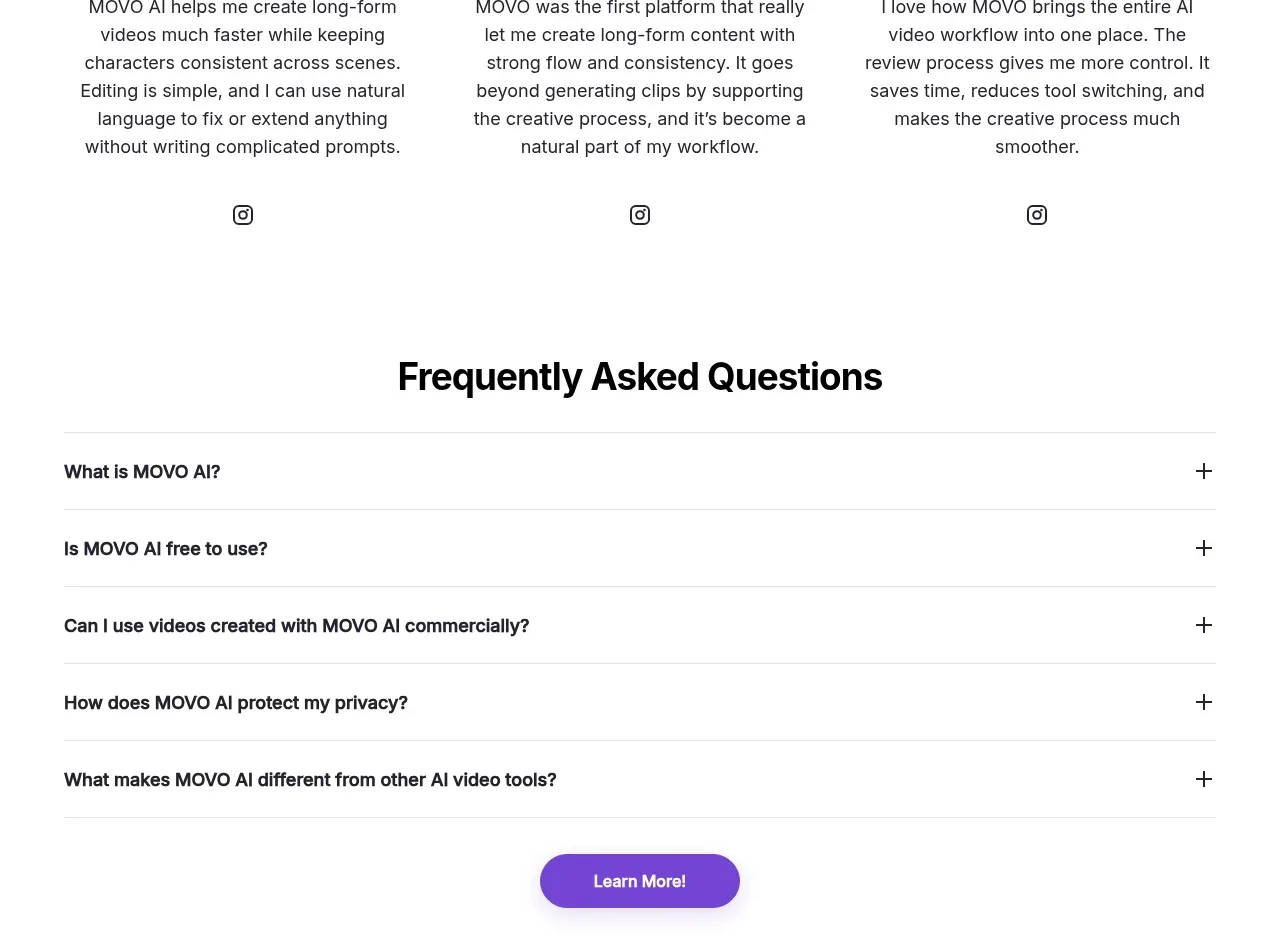
Creator testimonials
MOVO AI · Testimonials

 Founder and team testimonials
Fastlane 2.0 · Testimonials
Founder and team testimonials
Fastlane 2.0 · Testimonials
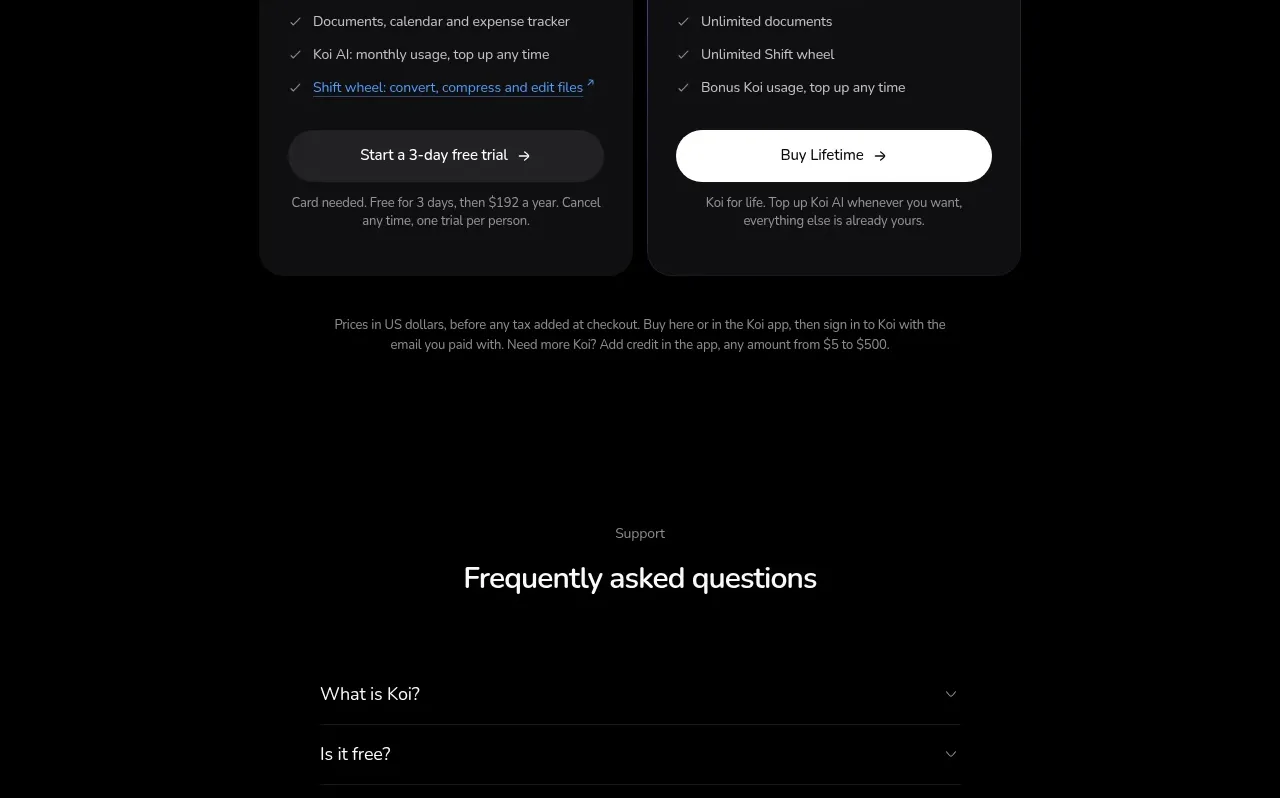
 Customer proof carousel
Koi · Testimonials
Customer proof carousel
Koi · Testimonials