kage
kage
buddy.works
Design analysis
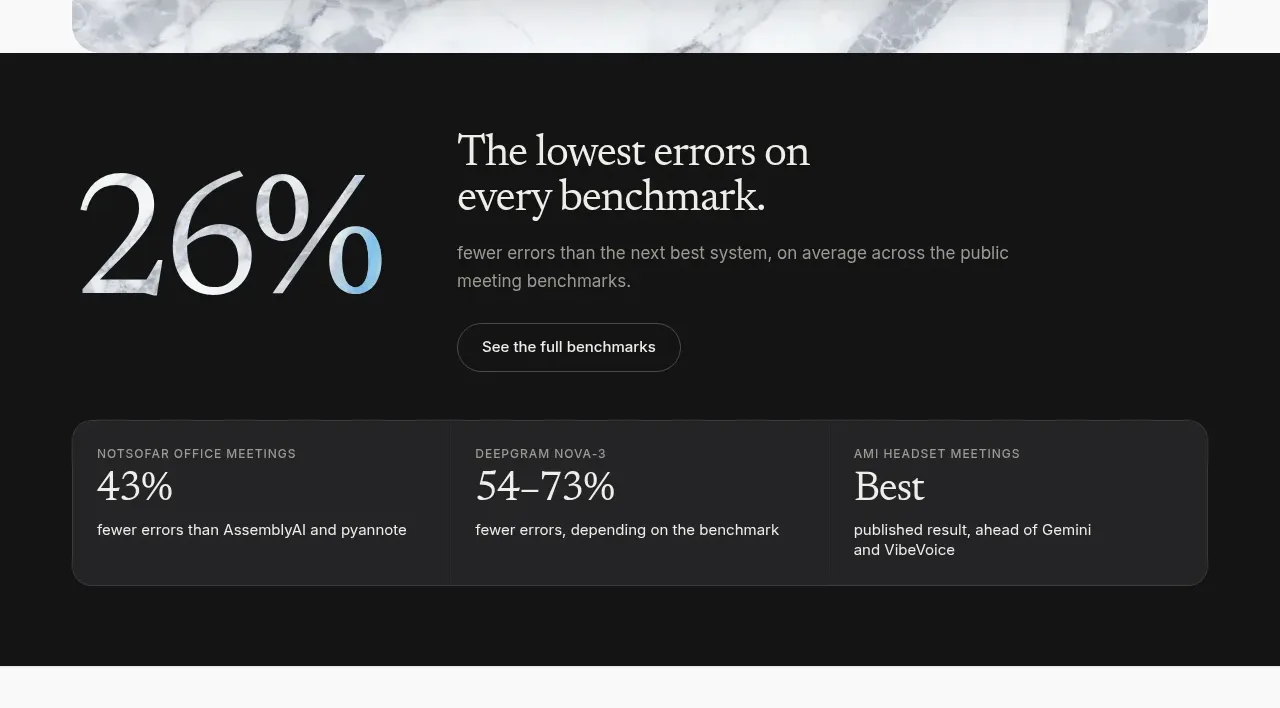
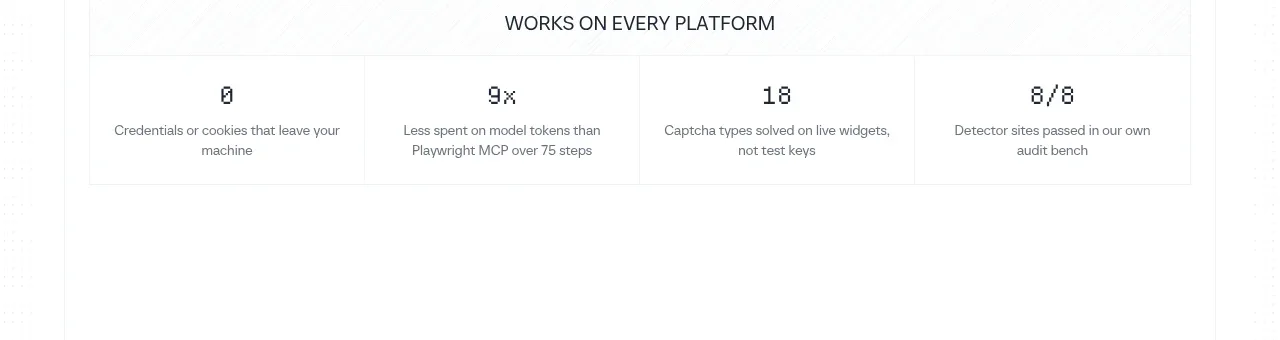
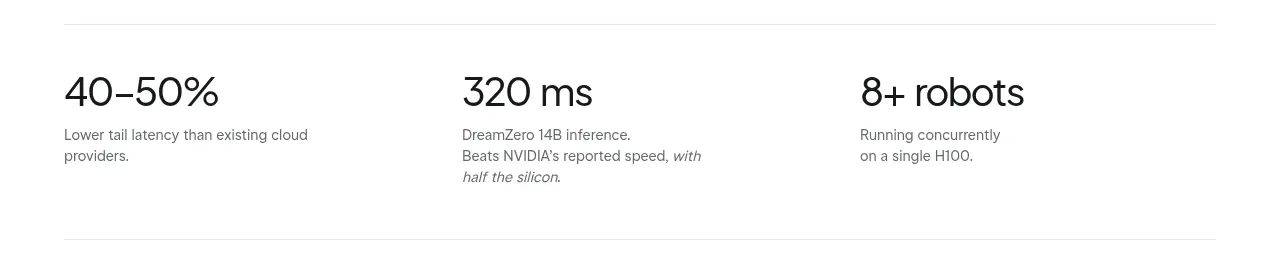
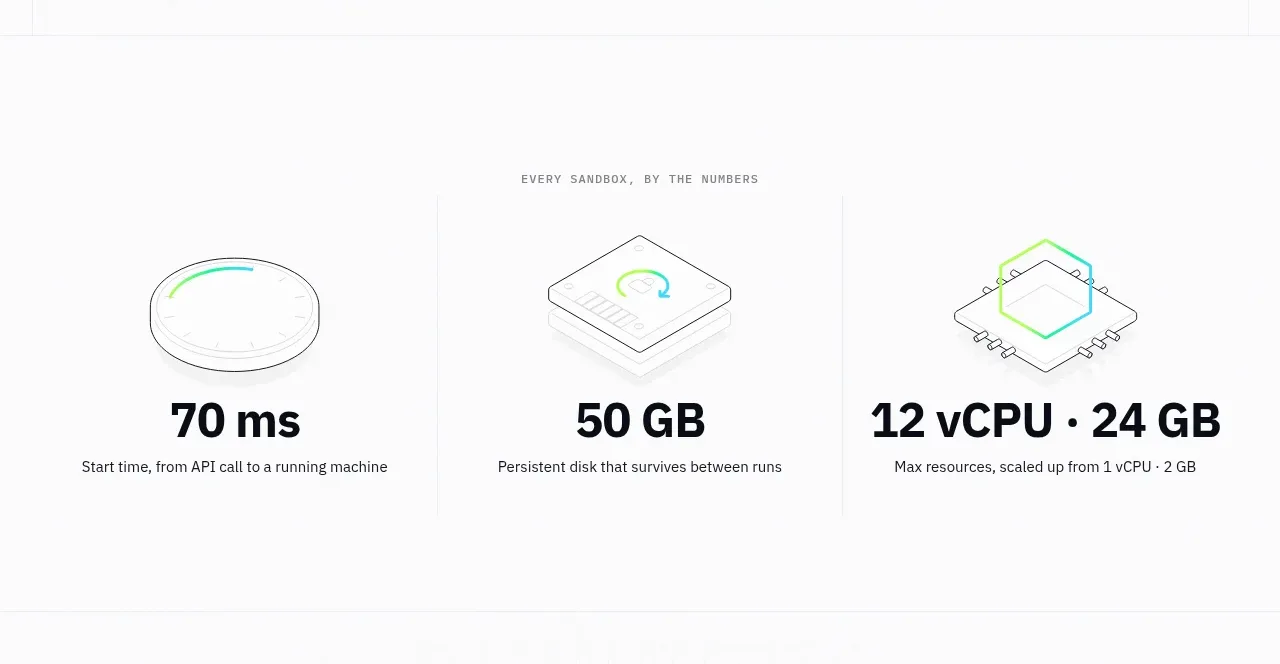
Three large metrics are organized as equal columns, each with a simple technical illustration above a bold value and a clarifying caption.
Prompt preview
## Reference images

Study these alongside the description below: hierarchy, rhythm, spacing, colour. Build for the product you are asked about, using this design language.

- Component: https://kage-design-assets.t3.tigrisfiles.io/components/ai-sandboxes-by-buddy/f0e6e8b3-2b0a-4e1e-b3c7-06d5e5447056-1792130829-3.webp
- Full page it was cut from: https://kage-design-assets.t3.tigrisfiles.io/screenshots/ai-sandboxes-by-buddy/f0e6e8b3-2b0a-4e1e-b3c7-06d5e5447056-1792130620611-full.webp
- Component on Kage: https://kage.design/component/ai-sandboxes-by-buddy-stats

## Before you start
Ask what measurable outcomes matter for the user's product and whether the metrics should be quantitative, qualitative, or both. Then create a branded stats section around those answers.

Create a centered metrics band with a muted uppercase section label and three equal-width columns. Each column should contain a lightweight abstract line icon or diagram, a large bold metric, and a short explanatory caption. Use a white background, subtle vertical separators between columns, and a restrained technical visual language. Values can be 34–42px, heavy, with near-black #101218; labels should be 12–14px in #3F454D. Keep icons as original CSS/SVG geometry using lime #B9FF4A and cyan #35C9EE accents with pale gray strokes. Give the section 88–120px vertical padding and collapse to a vertical stack on mobile.

Never: use the reference's product name, exact metrics, exact copy, illustrations, or imagery.