kage
kage
scalebrowser.net

Design analysis
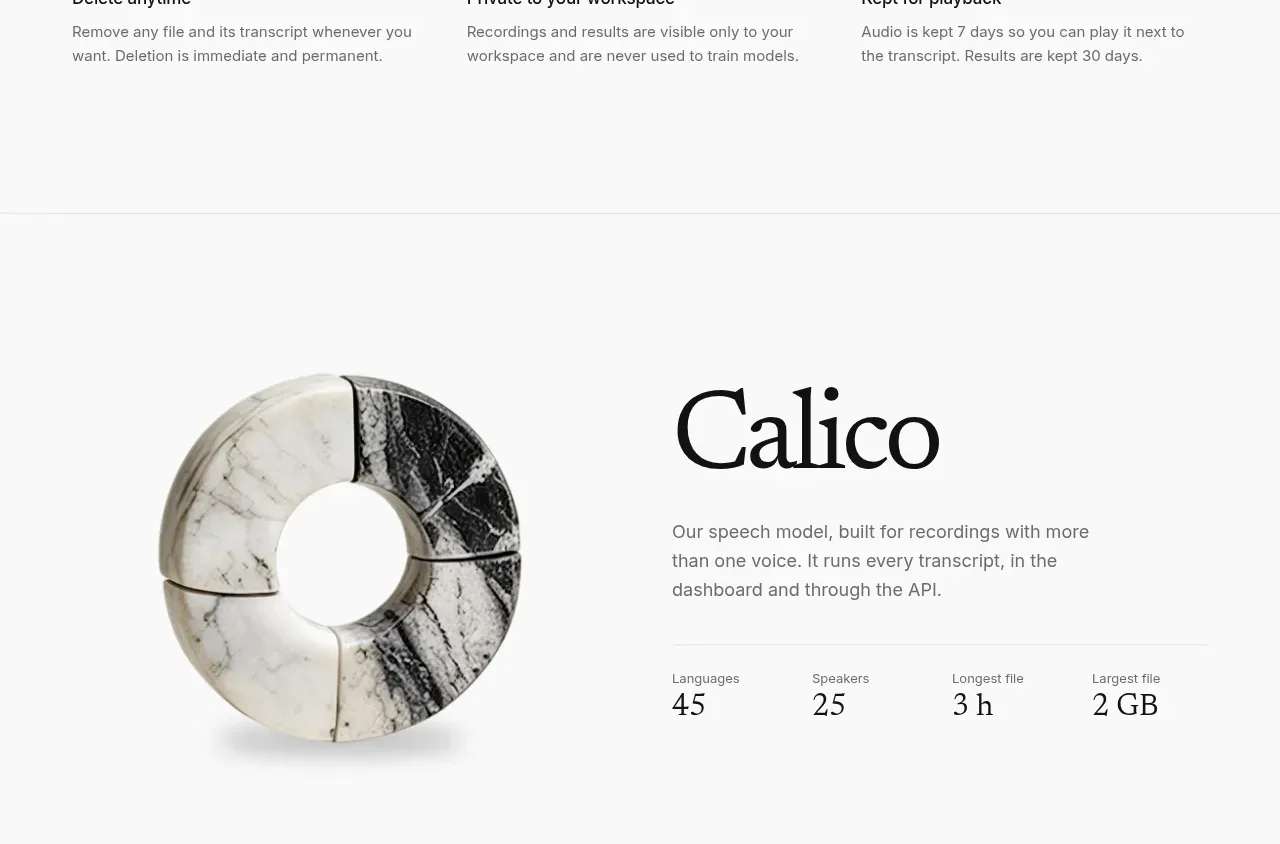
Four compact metrics turn product claims into scan-friendly proof, with oversized values and short explanatory labels in equal columns.
Prompt preview
## Reference images

Study these alongside the description below: hierarchy, rhythm, spacing, colour. Build for the product you are asked about, using this design language.

- Component: https://kage-design-assets.t3.tigrisfiles.io/components/scalebrowser/2a4622f4-ebe3-4b20-ac5d-aef2ae1302c9-1792216897-3.webp
- Full page it was cut from: https://kage-design-assets.t3.tigrisfiles.io/screenshots/scalebrowser/2a4622f4-ebe3-4b20-ac5d-aef2ae1302c9-1792216866183-full.webp
- Component on Kage: https://kage.design/component/scalebrowser-stats

## Before you start
Ask which measurable outcomes are credible for the user's product and which audiences need reassurance. Use those answers to create honest, contextual metrics.

Create a four-column proof band with a small all-caps or compact section label above it. Give each metric a large dark value, then a short muted explanation below; align all columns to a shared baseline and divide them with very light vertical rules. Use white background, #171c24 values, #69747e descriptions, 28–32px metric type, 12px body type, and 56–72px vertical padding. On small screens, switch to a two-column grid and preserve generous spacing.

Never use logos, product names, copy, illustrations, or imagery from the reference.