kage
kage
dreamscalelabs.com

Design analysis
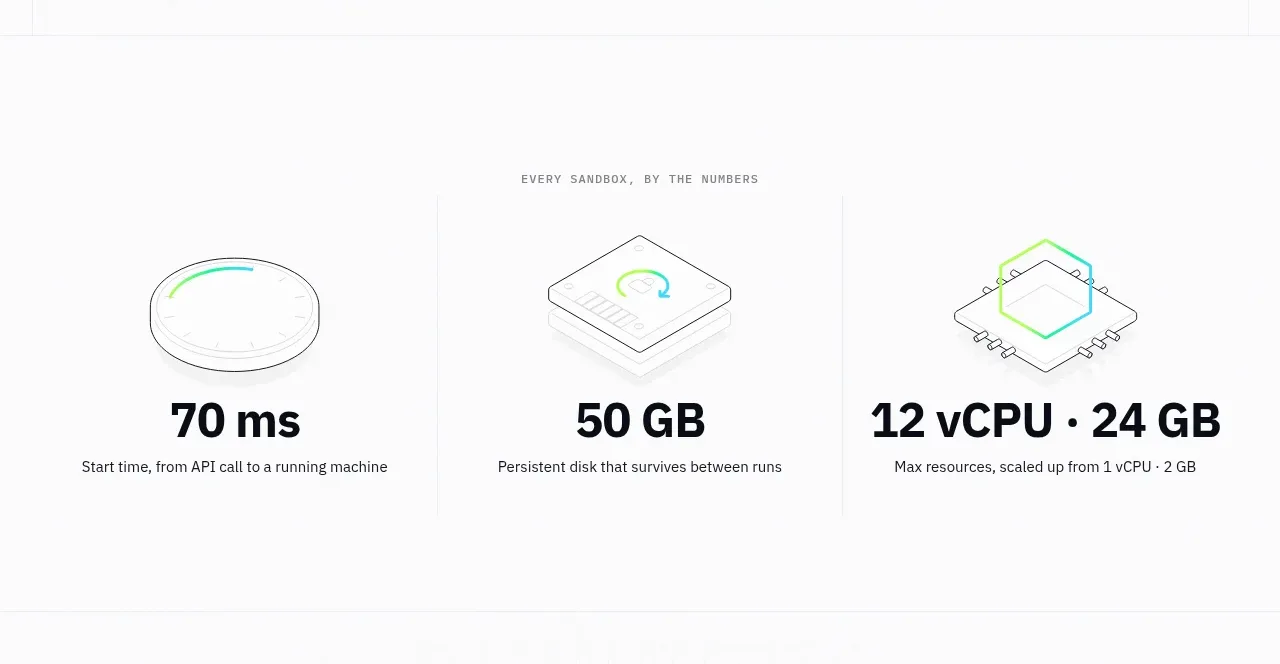
Three evenly distributed metrics turn the product claim into scannable proof. Large numeric values are supported by short, muted explanatory lines and separated from adjacent sections by thin rules.
Prompt preview
## Reference images

Study these alongside the description below: hierarchy, rhythm, spacing, colour. Build for the product you are asked about, using this design language.

- Component: https://kage-design-assets.t3.tigrisfiles.io/components/dreamscale-labs/1997d92a-7a08-4743-8853-9f94160e0cd8-1792130787-3.webp
- Full page it was cut from: https://kage-design-assets.t3.tigrisfiles.io/screenshots/dreamscale-labs/1997d92a-7a08-4743-8853-9f94160e0cd8-1792130510959-full.webp
- Component on Kage: https://kage.design/component/dreamscale-labs-stats

## Before you start
Ask the user which measurable outcomes are credible for their product and what units or qualifiers matter. Use those answers instead of inventing claims.

Build a three-column metrics band inside a centered container. Put a thin top and bottom divider in #e2e5e6, with roughly 32–38px vertical padding. Each column has a large 28–30px value in near-black #151719, then a compact 12px explanatory description in gray #6d7277 with a comfortable 1.35 line-height. Keep columns aligned and evenly spaced, with no heavy cards or backgrounds. Support responsive collapse to one or two columns while preserving the hierarchy. Use the primary brand color only for optional accents, not for every number.

Never: use logos, product names, copy, illustrations, or imagery from the reference.