 kage
cloudknife.com
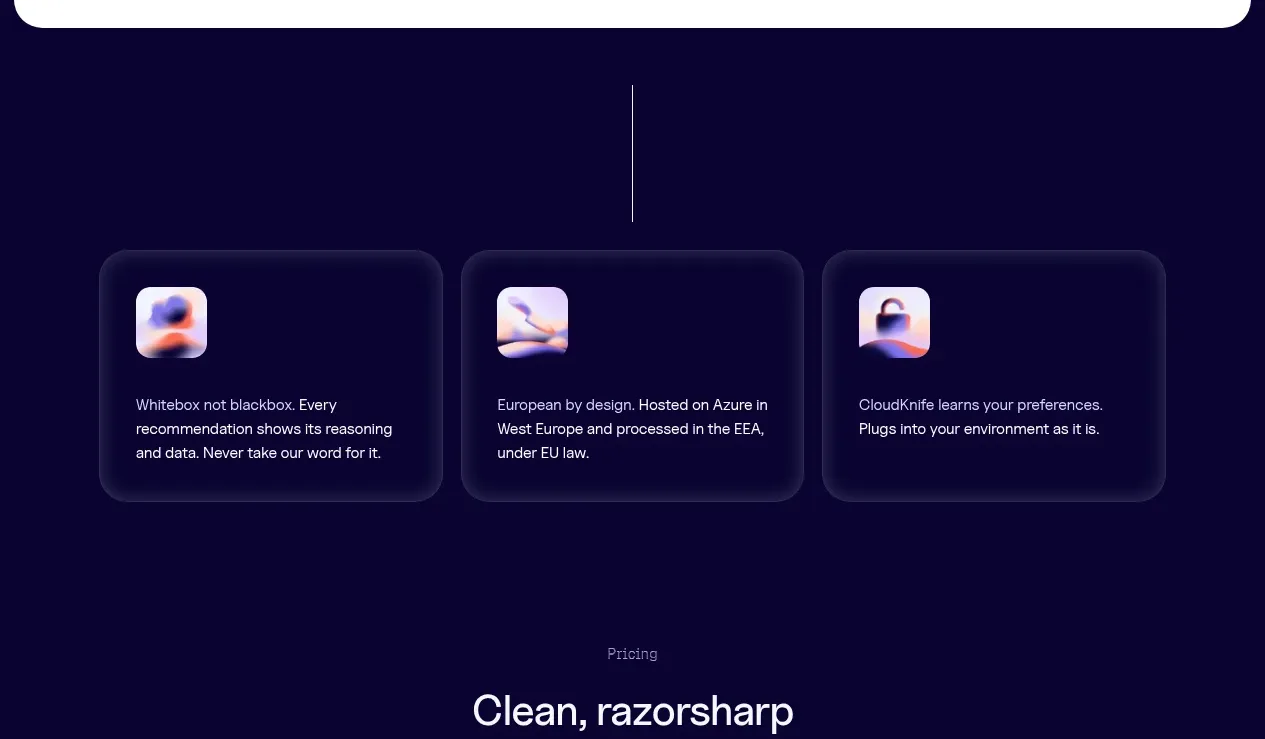
Design analysis
A dark case-study band pairs a concise outcome statement and CTA with a low-contrast rising area chart, making quantitative proof visible without overwhelming the message.
Prompt preview
## Reference images

Study these alongside the description below: hierarchy, rhythm, spacing, colour. Build for the product you are asked about, using this design language.

- Component: https://kage-design-assets.t3.tigrisfiles.io/components/cloudknife/9dafaa08-16c6-4721-8c78-296bafbb7abc-1793081092-7.webp
- Full page it was cut from: https://kage-design-assets.t3.tigrisfiles.io/screenshots/cloudknife/9dafaa08-16c6-4721-8c78-296bafbb7abc-1793080968695-full.webp
- Component on Kage: https://kage.design/component/cloudknife-chart

## Before you start
Ask what the user's product is, who it serves, and what their brand personality and visual identity are. Apply the following principles to that product rather than copying the reference.

Build a dark case-study proof band with a two-column layout. On the left, place a small context label, a large numerical outcome, one supporting sentence, and two compact CTA buttons. On the right, show a restrained line or area chart that rises toward a highlighted metric, with sparse grid lines and a clear annotation. Use #0b0630 as the background, #f5f3ff for primary text, #9586ff for chart strokes, and a translucent violet fill. Keep the chart decorative but semantically labeled, responsive, and accessible with a text summary. Use 16–24px gaps and a subtle vertical divider near the metric callout.

Never: use logos, product names, copy, illustrations, or imagery from the reference.
More components
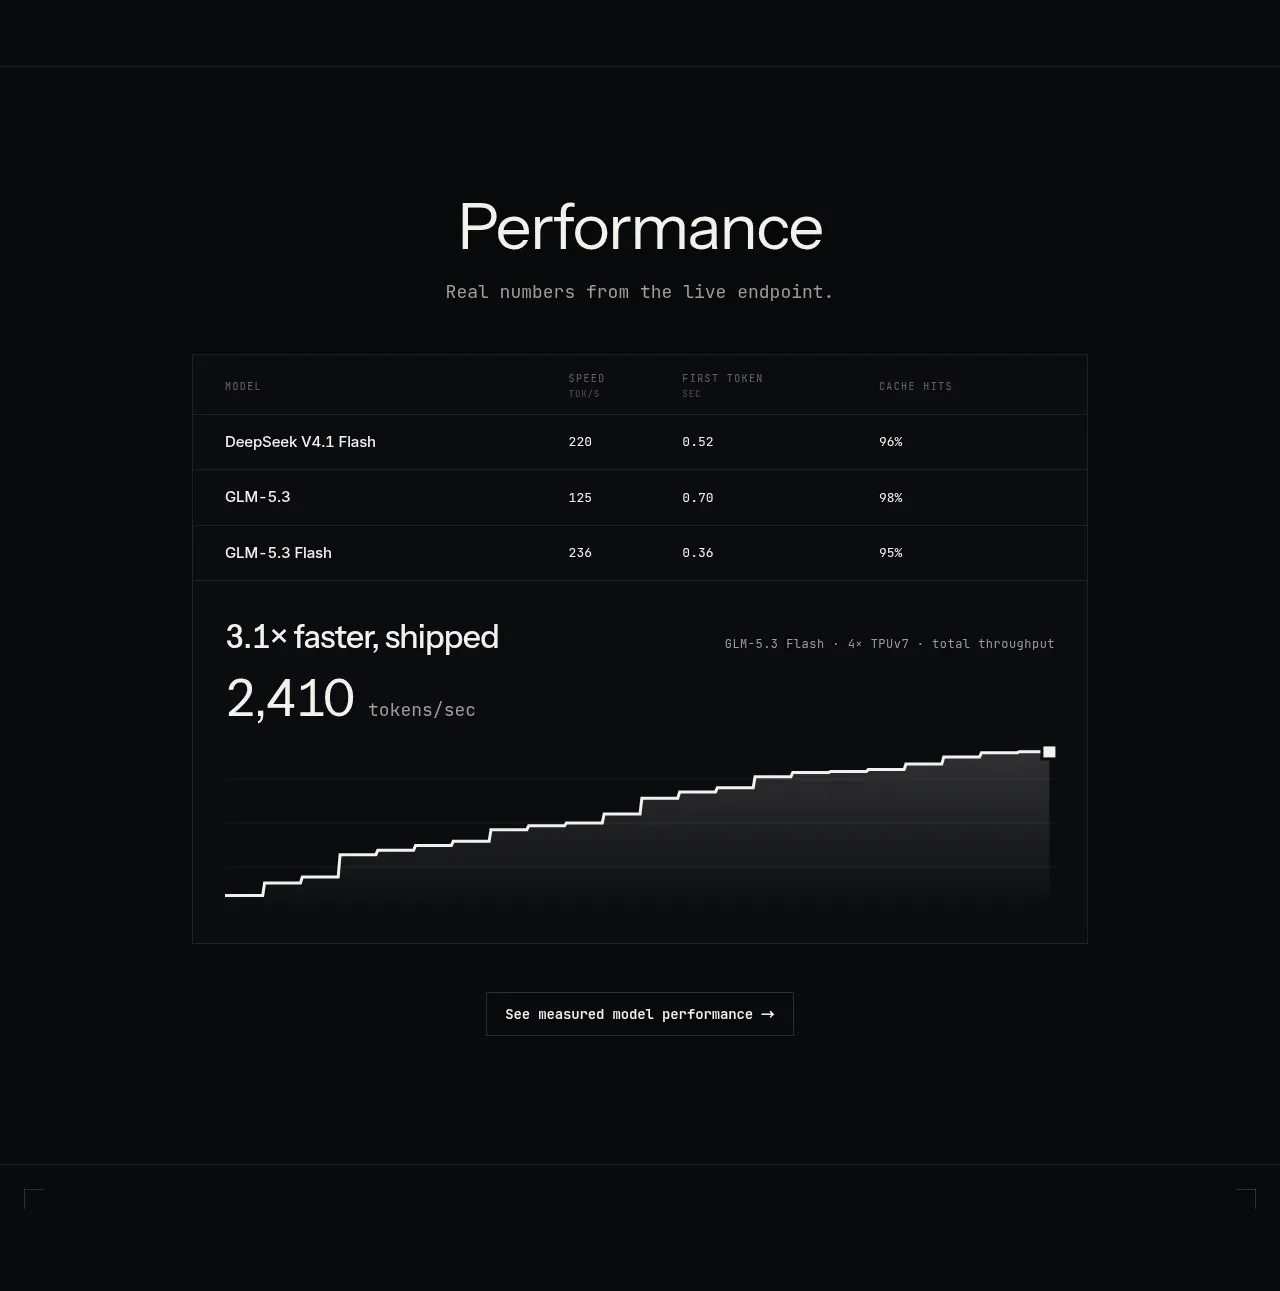
 Performance benchmark
Zro: Uncensored Security Models · Chart
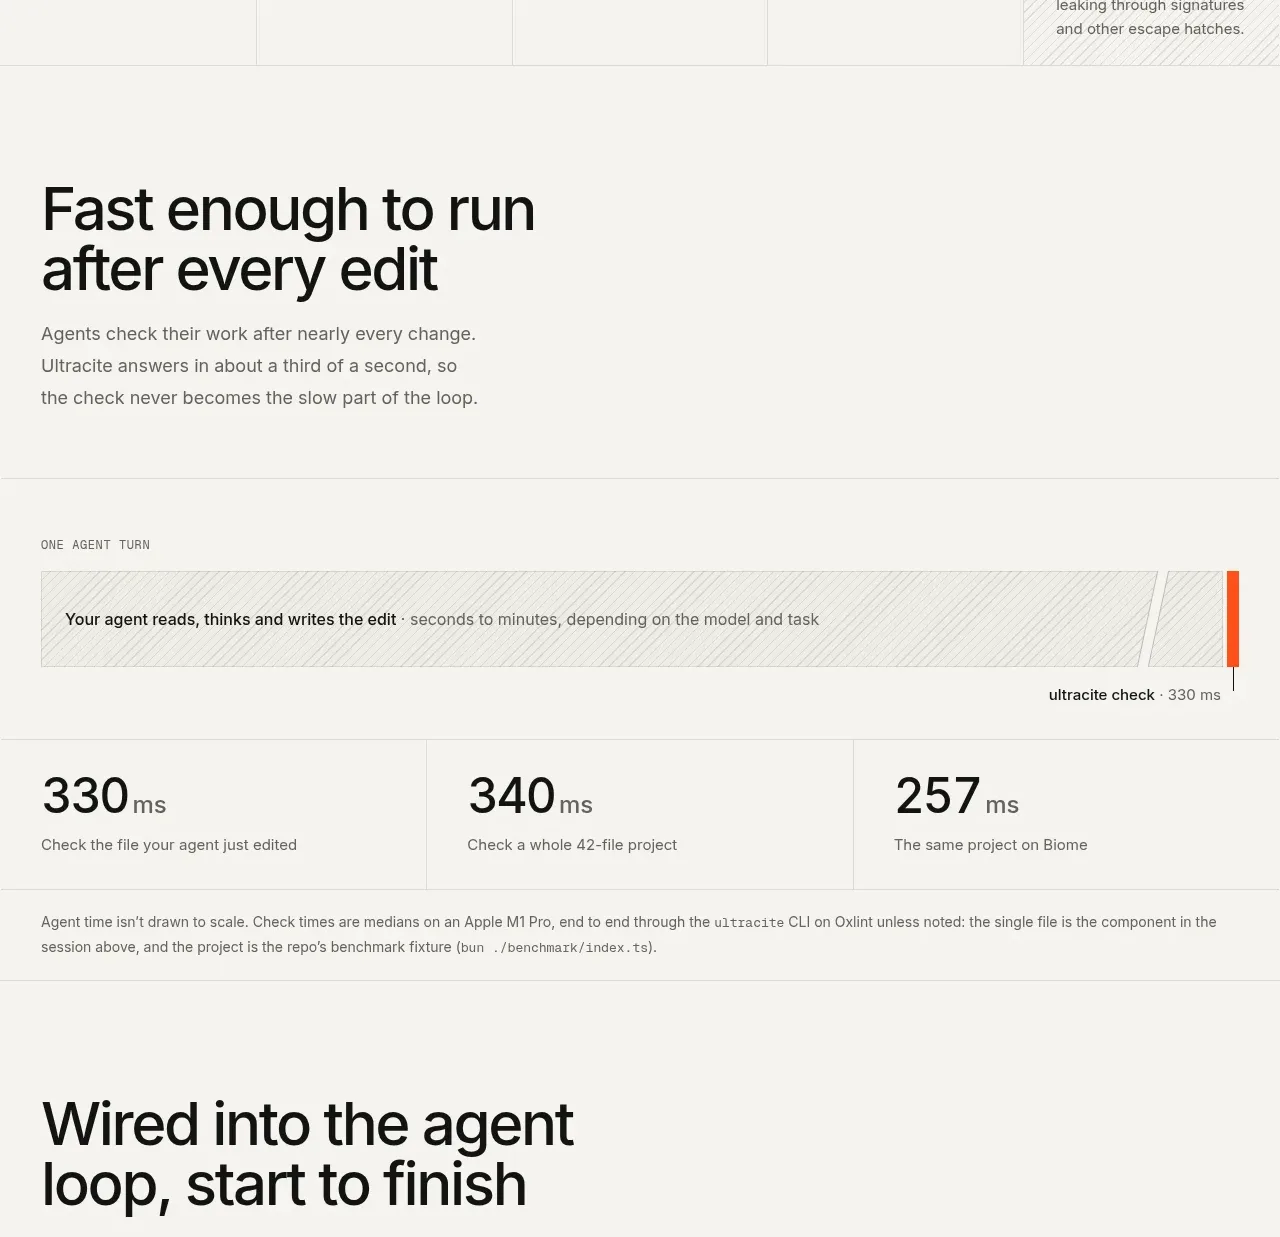
 Fast feedback timing comparison
Ultracite v8 · Chart
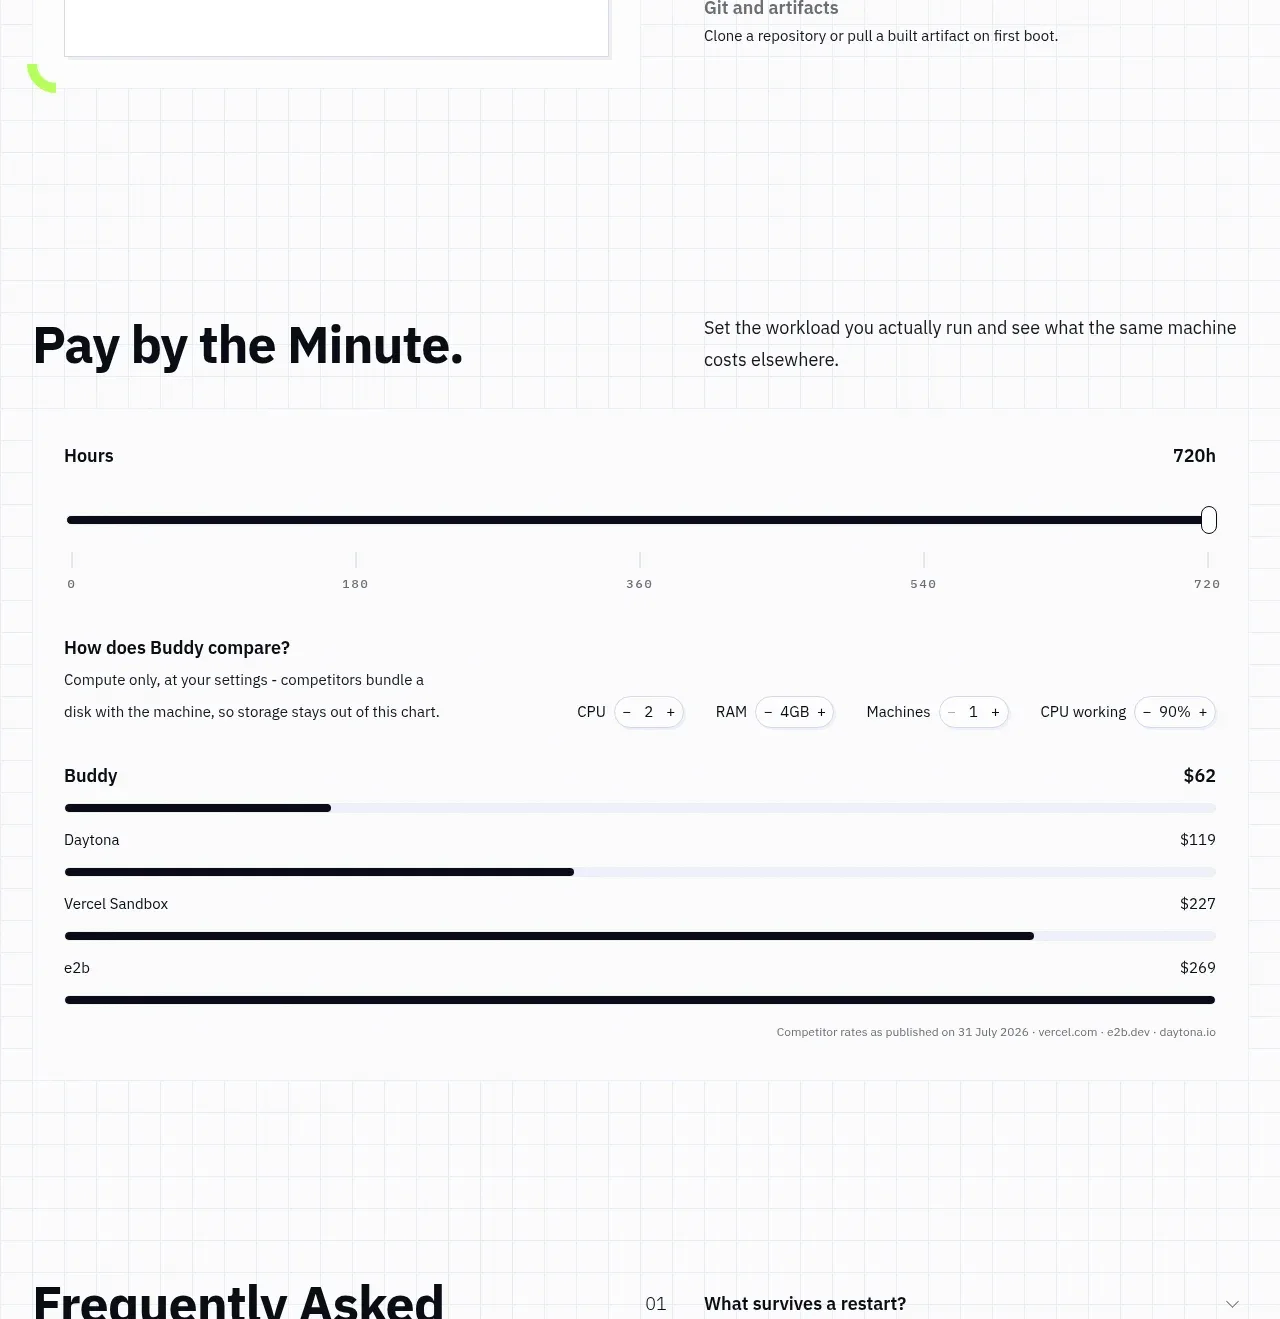
 Usage and cost comparison
AI Sandboxes by Buddy · Chart
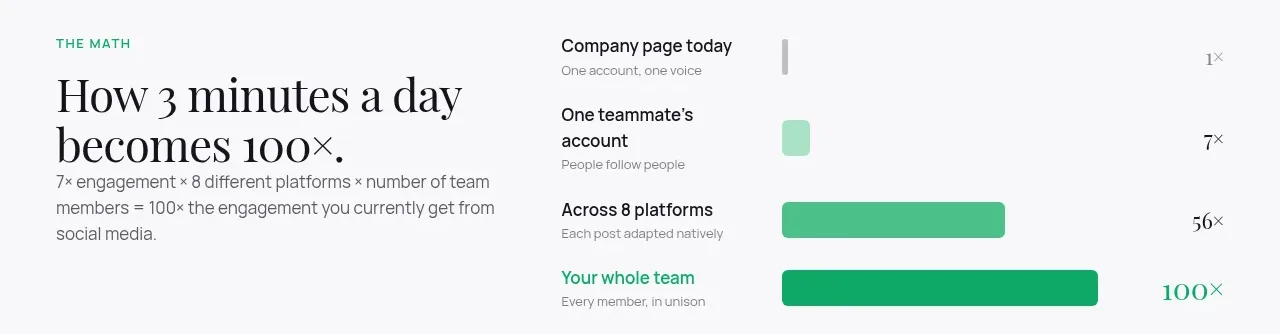
 Time-to-impact comparison
Agent Craft · Chart
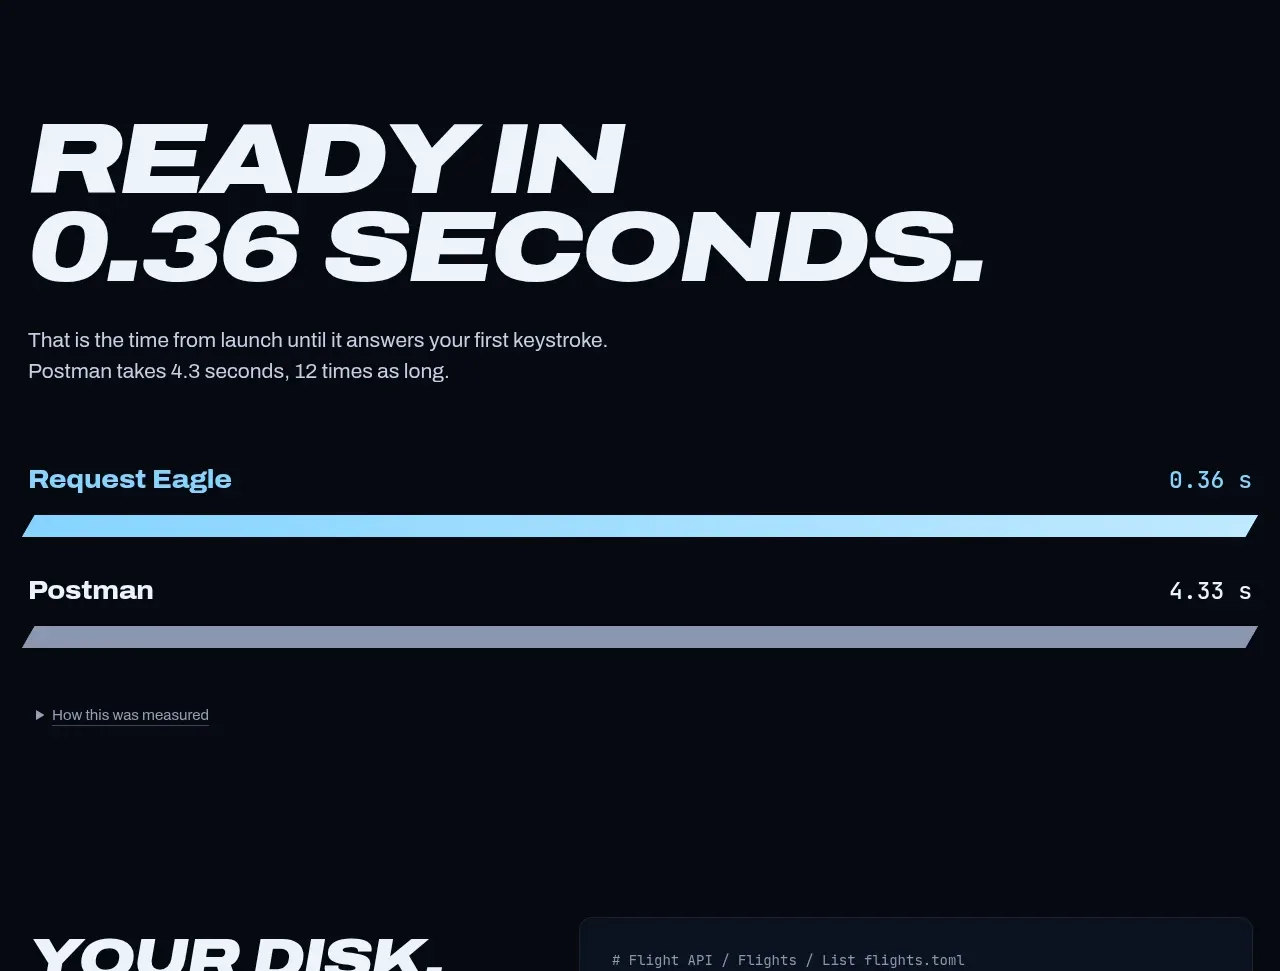
 Performance comparison chart
Request Eagle · Chart
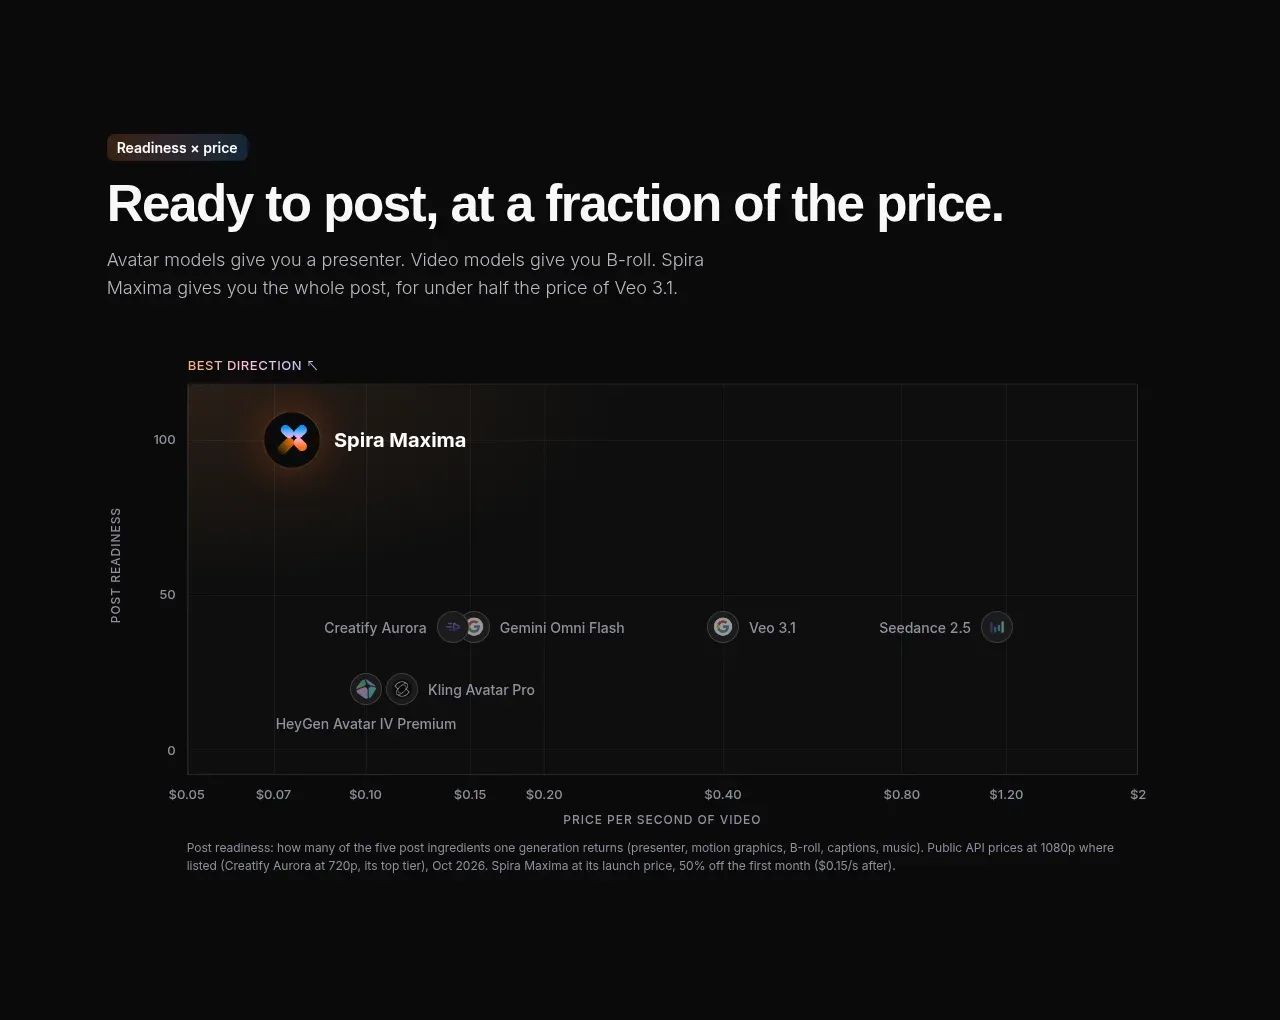
 Value positioning scatter chart
Spira Maxima · Chart