kage
kage
ultracite.ai
Design analysis
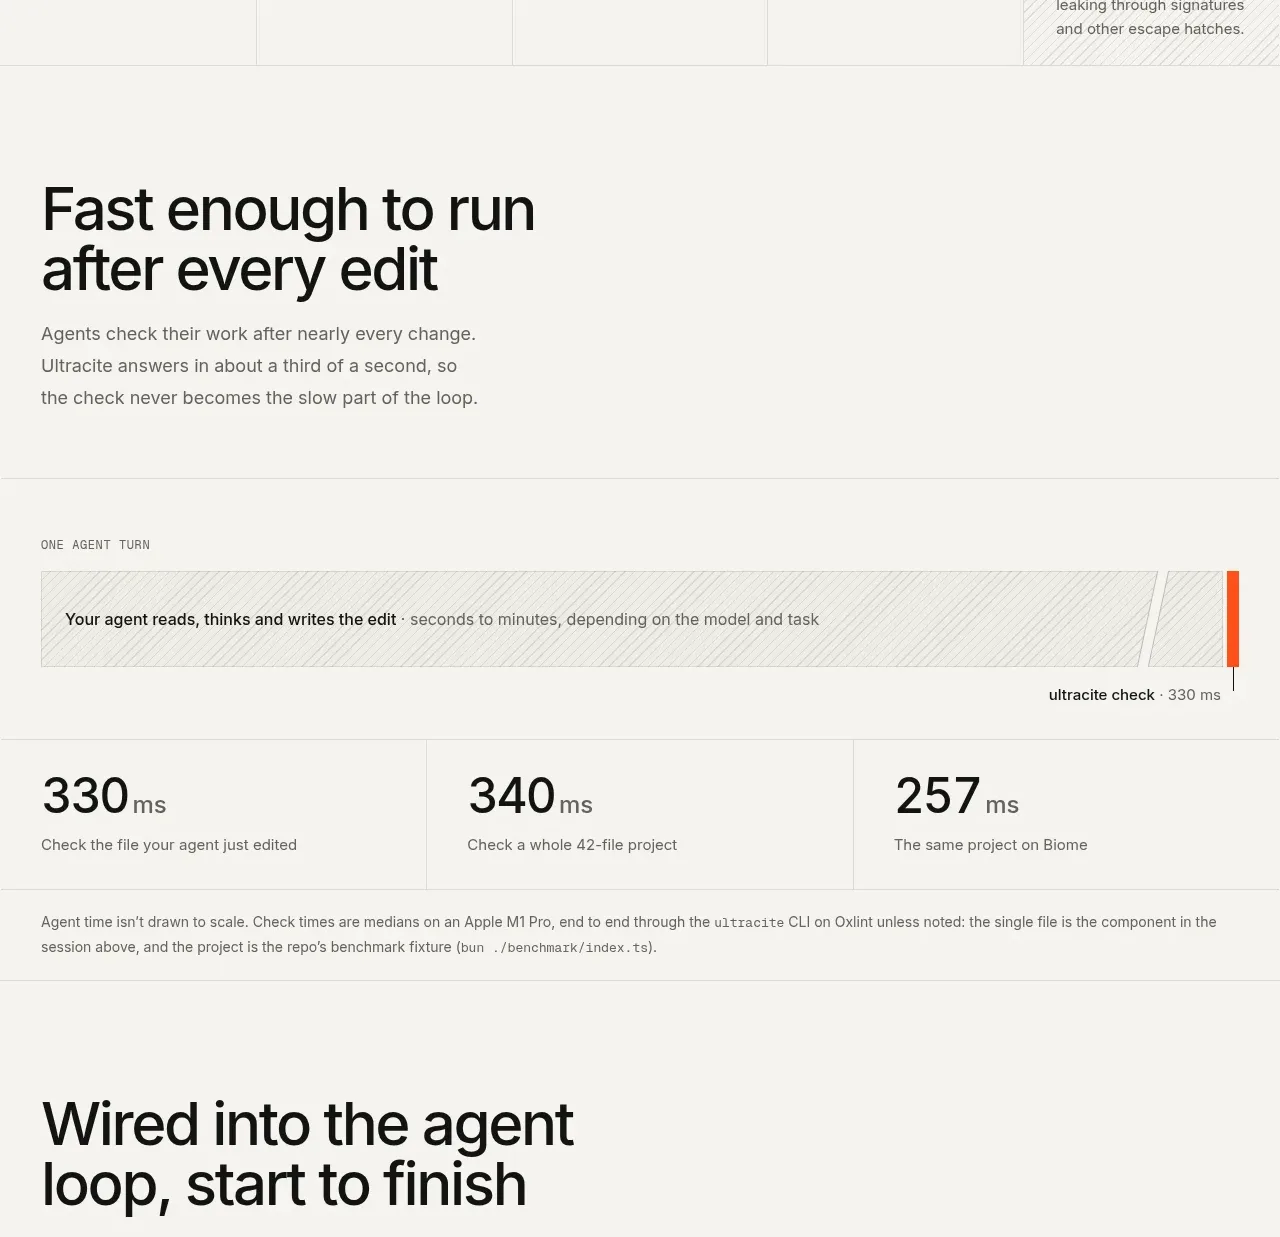
A performance section introduces speed in plain language, visualizes an edit-to-check loop as a horizontal timing bar, and ends with three benchmark figures plus methodology notes. The chart is persuasive because the measurement context remains visible.
Prompt preview
## Reference images

Study these alongside the description below: hierarchy, rhythm, spacing, colour. Build for the product you are asked about, using this design language.

- Component: https://kage-design-assets.t3.tigrisfiles.io/components/ultracite-v8/2cfe6d77-9aac-44fd-bb06-05dad12091d2-1792303306-4.webp
- Full page it was cut from: https://kage-design-assets.t3.tigrisfiles.io/screenshots/ultracite-v8/2cfe6d77-9aac-44fd-bb06-05dad12091d2-1792303236925-full.webp
- Component on Kage: https://kage.design/component/ultracite-v8-chart

## Before you start
Ask what performance metric matters to the user's product, how it is measured, and which comparisons are honest. Apply those constraints to an original benchmark section.

Build a performance section with a large headline and concise explanatory copy at the top. Add a wide horizontal process or timing visualization beneath it: label the workflow, show the main interval as a lightly patterned bar, and use one vivid accent marker to indicate the product's measured result. Follow with three evenly divided metric columns, each containing a large number, unit, and plain-language caption. Finish with a compact methodology note so readers understand the environment and scope.

Use #f7f7f4 and white surfaces, near-black #151514 type, warm gray #6b6b65, and one orange accent around #ff4b1f. Use 1px #deded9 separators, a 6–10px radius on the bar, and a subtle diagonal hatch or low-contrast texture only as supporting information. Numbers should be large and tabular, while captions remain 12–14px. Ensure the chart has semantic text equivalents, responsive stacking, and no misleading axes or arbitrary scaling.

### Never
- Never use the reference's logos, product names, copy, illustrations, or imagery.
- Never invent benchmark values or imply a comparison without methodology.
- Never use animation that obscures the actual result.