 kage
kage
idlen.io
Design analysis
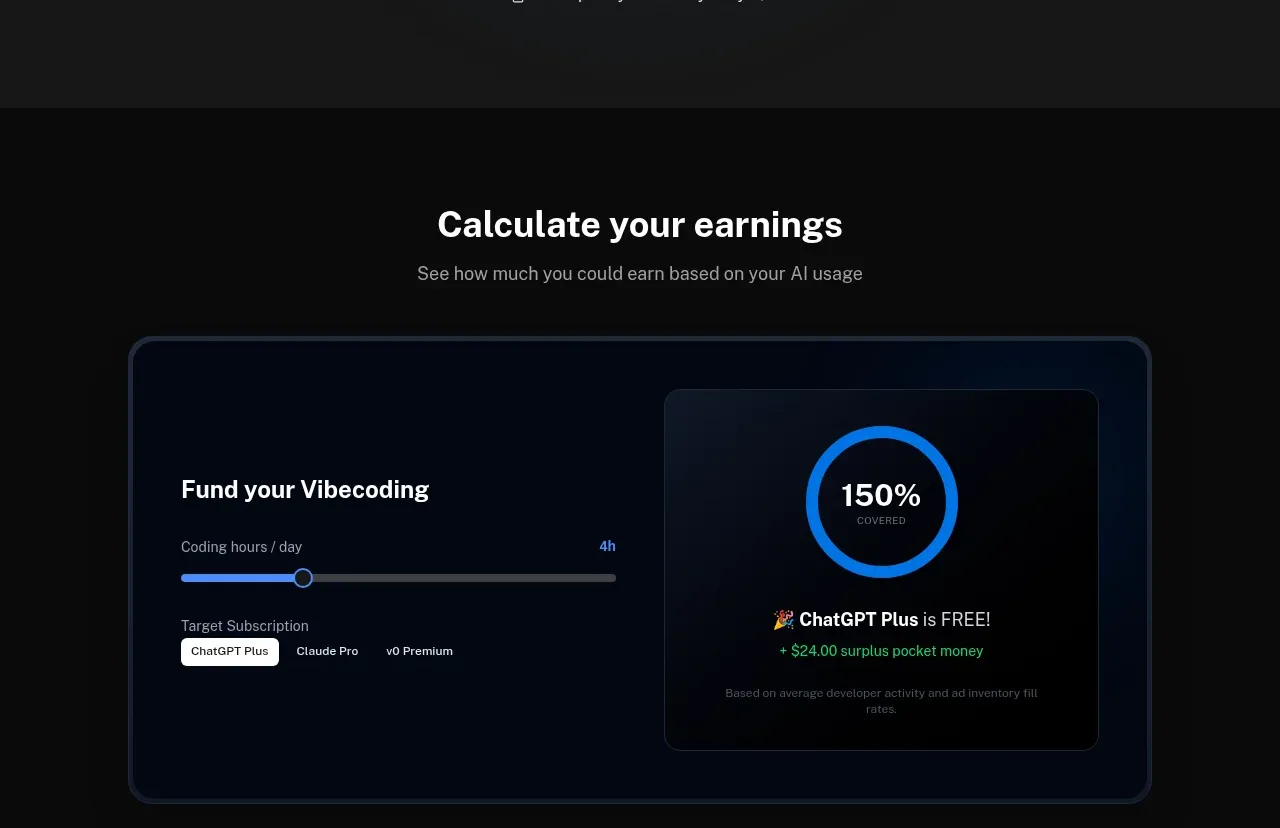
A high-contrast interactive calculator lets visitors adjust usage and subscription inputs, then shows a large coverage percentage and an explanatory payout result. The split-panel composition makes the economic proposition tangible.
Prompt preview
## Reference images

Study these alongside the description below: hierarchy, rhythm, spacing, colour. Build for the product you are asked about, using this design language.

- Component: https://kage-design-assets.t3.tigrisfiles.io/components/idlen/09112380-17fc-499b-a8d2-71eed663a053-1789538555-8.webp
- Full page it was cut from: https://kage-design-assets.t3.tigrisfiles.io/screenshots/idlen/09112380-17fc-499b-a8d2-71eed663a053-1789538482510-full.webp
- Component on Kage: https://kage.design/component/idlen-chart

## Before you start
Ask what the user's product, audience, and brand are, then apply the principles below to that product rather than copying this reference.

Build an interactive earnings calculator in a dark elevated panel. Put input controls on the left: a labeled range slider for usage and a compact segmented subscription selector. Put the calculated result on the right in a separate darker card with a large circular progress ring, percentage, result label, and a concise explanatory note.

Design rules:
- Use a centered max-width 720px panel with a two-column layout and generous 34–44px padding.
- Use a 28–32px section heading above it, 16px panel labels, 12px field labels, and a very large 30–40px result.
- Approximate colours: page #0b0b0c, panel #050a17, inner card #10151e, border #1b3156, blue #168cff, green #42c88a, text #f5f7fb, muted #7e8795.
- Use 14px panel radius, a subtle blue outer glow, and a 1px border.
- Update the ring, result, and supporting copy immediately as inputs change; provide keyboard-accessible slider and segmented controls.
- Stack the result below the controls on mobile.

Never:
- Never use logos, product names, copy, illustrations, or imagery from the reference.
- Never fabricate an earnings guarantee or hide the calculation assumptions.
- Never make the chart decorative: every visual should correspond to a live input.
More components
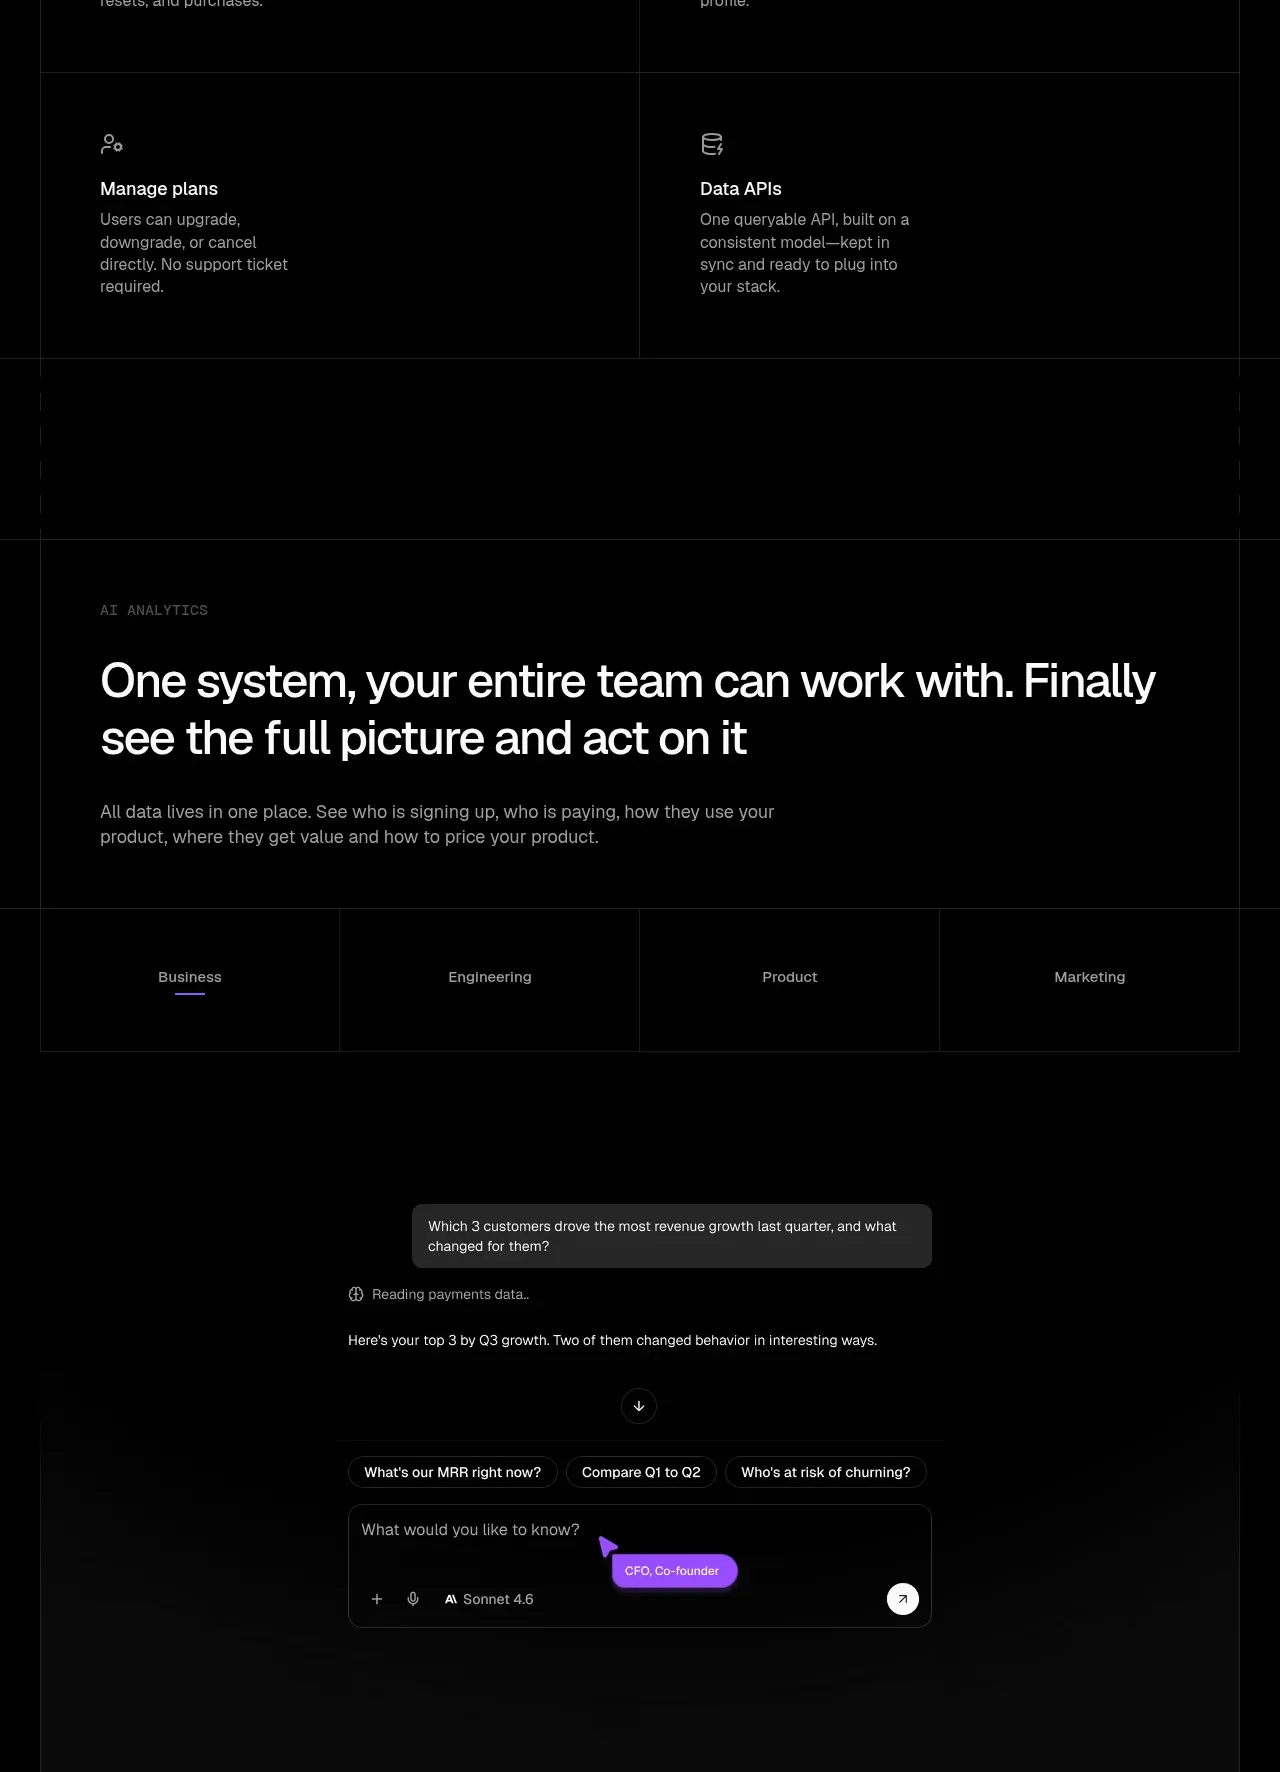
 Analytics and agent insight workspace
tiun. · Chart
Analytics and agent insight workspace
tiun. · Chart
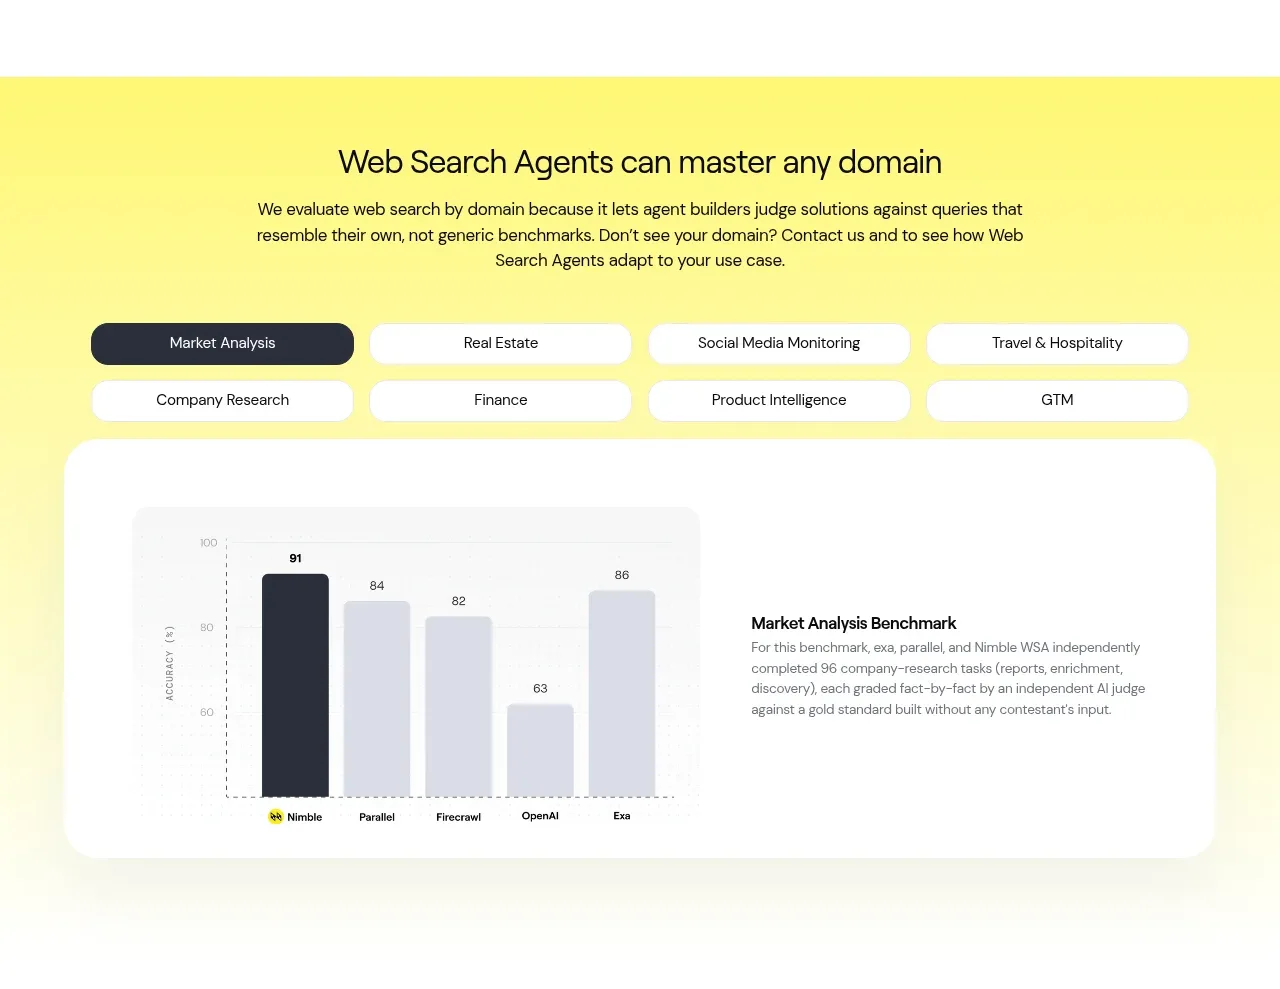
 Domain benchmark and tabs
Web Search Agents by Nimble · Chart
Domain benchmark and tabs
Web Search Agents by Nimble · Chart
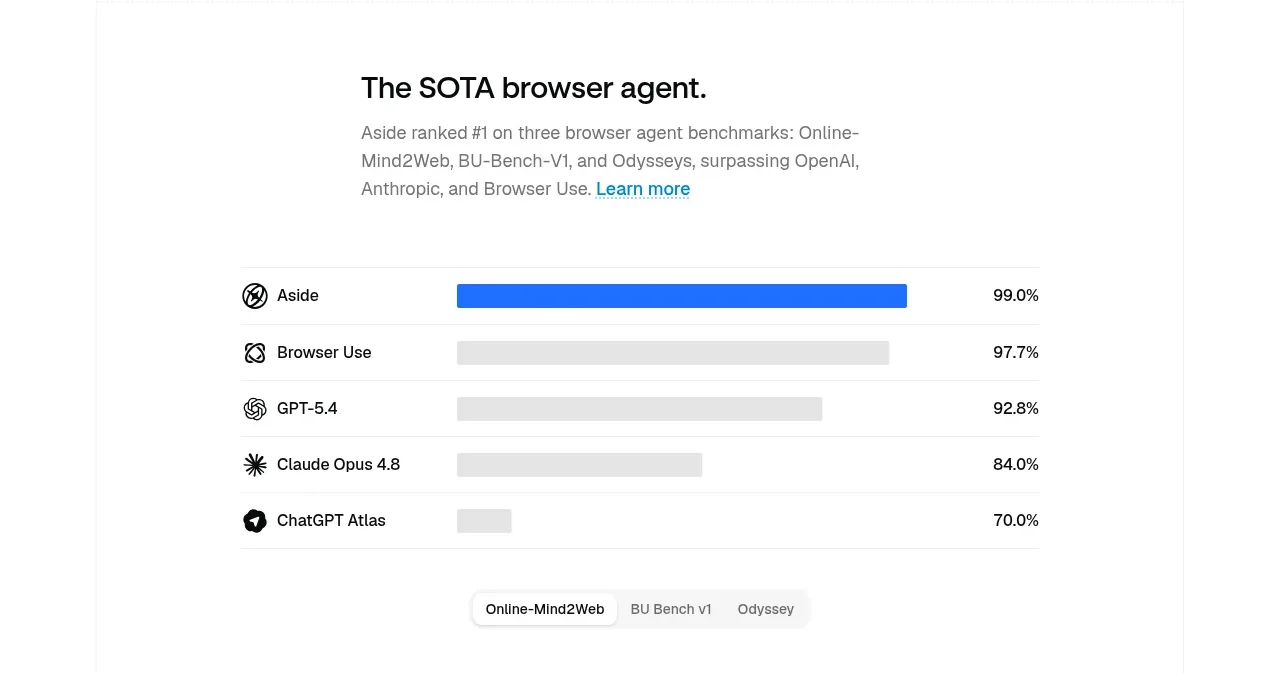
 Agent benchmark comparison
Aside · Chart
Agent benchmark comparison
Aside · Chart
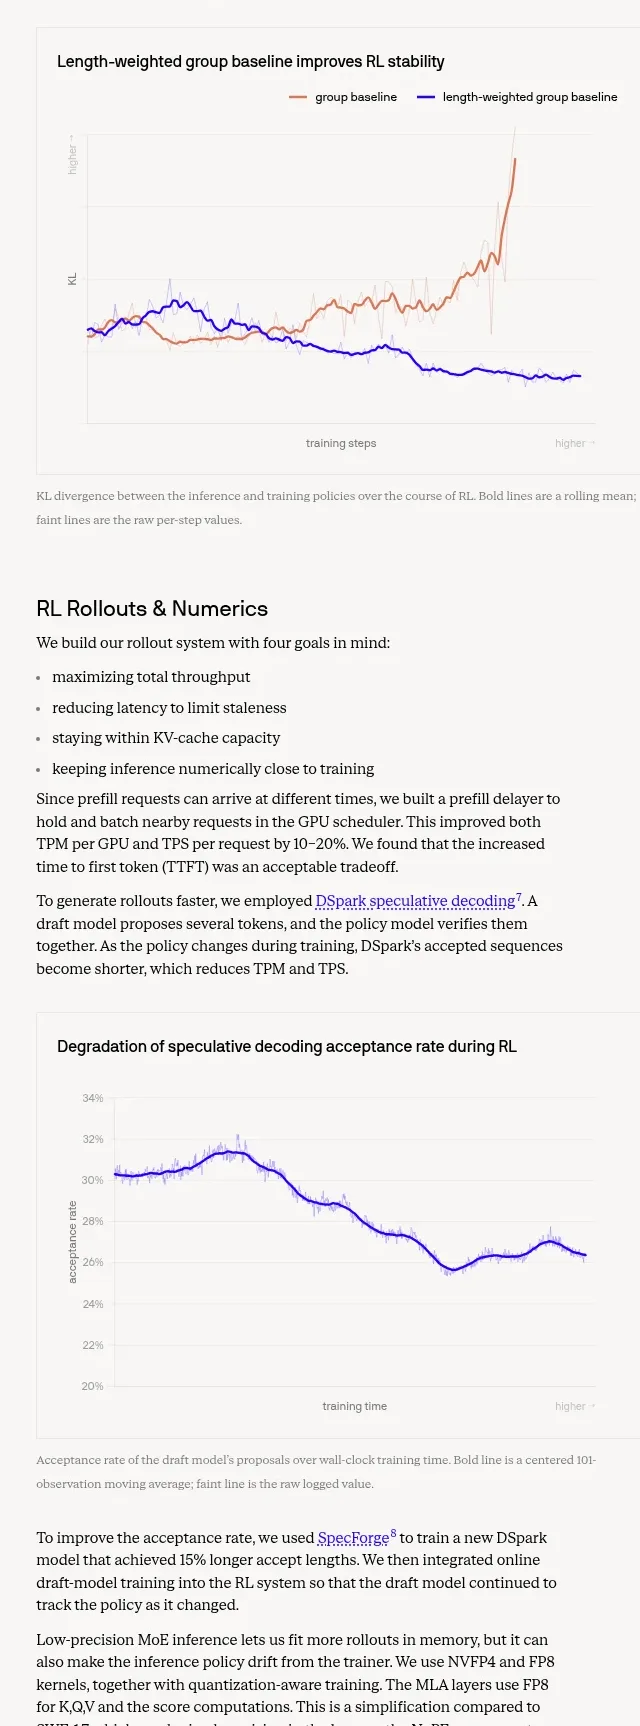
 Trustworthiness evaluation charts
Cognition's SWE-2 · Chart
Trustworthiness evaluation charts
Cognition's SWE-2 · Chart
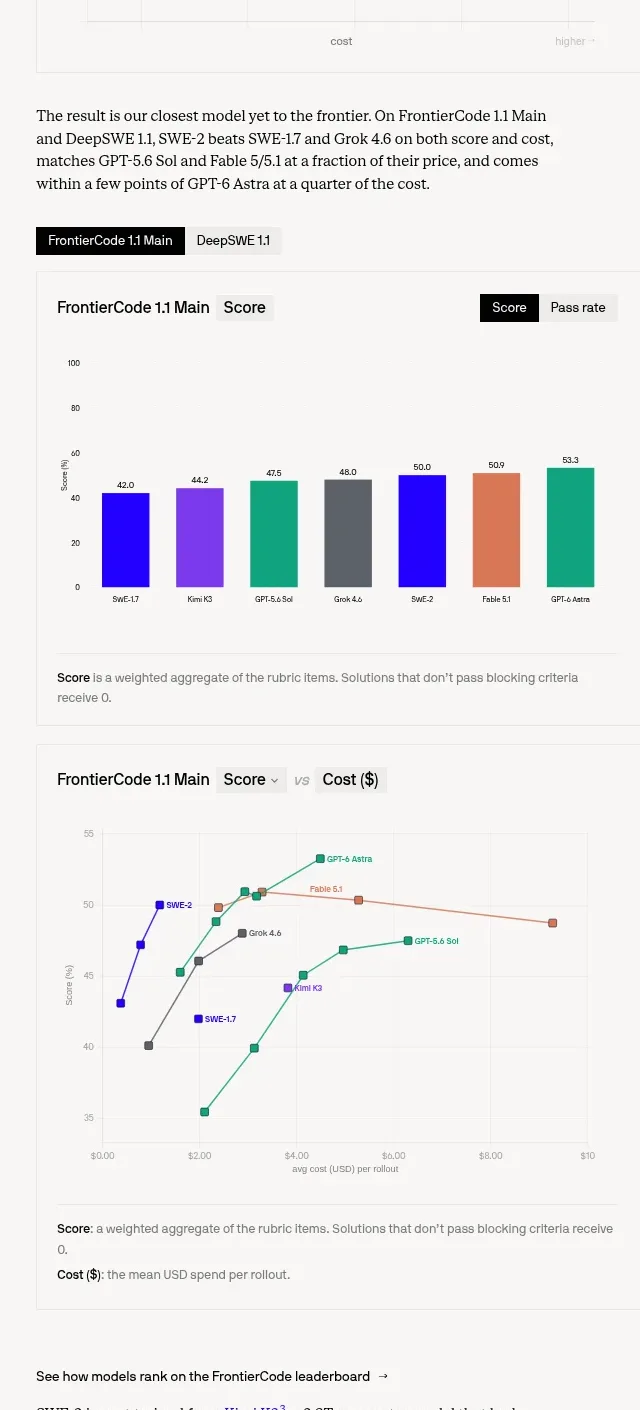 Benchmark score and cost charts
Cognition's SWE-2 · Chart
Benchmark score and cost charts
Cognition's SWE-2 · Chart
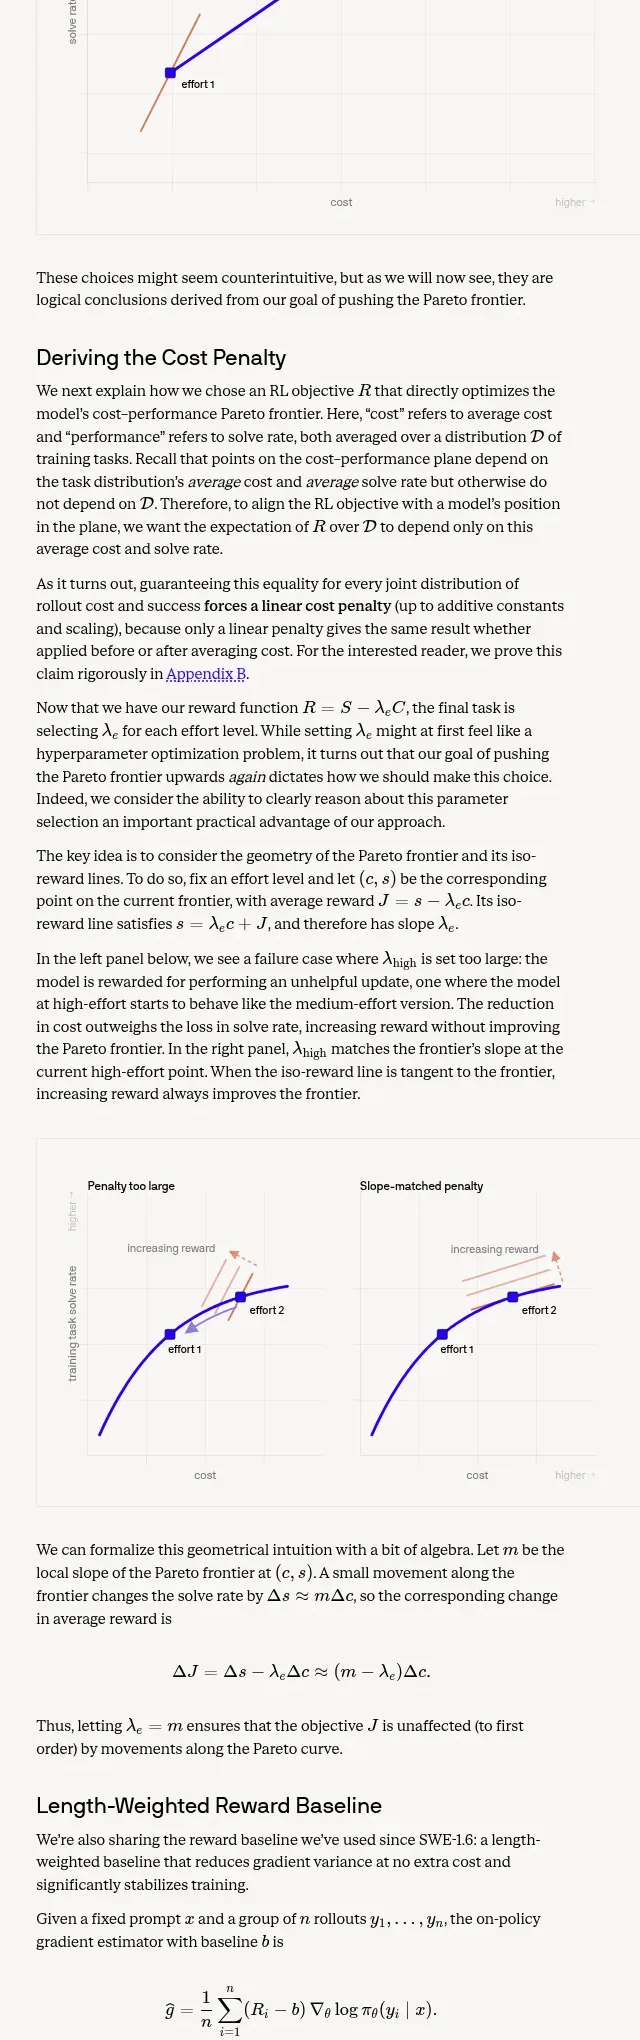 Length-weighted reward and RL stability
Cognition's SWE-2 · Chart
Length-weighted reward and RL stability
Cognition's SWE-2 · Chart